Acknowledgements
- Imperial
- Cambridge
- Lydia Drumright
- James Lester
- UNC Chapel Hill
- Bar Ilan
- Yakir Berchenko
- Jonathan Rosenblatt
- Western
- LSHTM
- UCLA
- Steve Shoptaw
- Pamina Gorbach
- Wisconsin-Madison
- McGill
- Oregon
- Nelson Ting
- Maria Jose Ruiz Lopez
- CDC
Networks are important in disease transmission
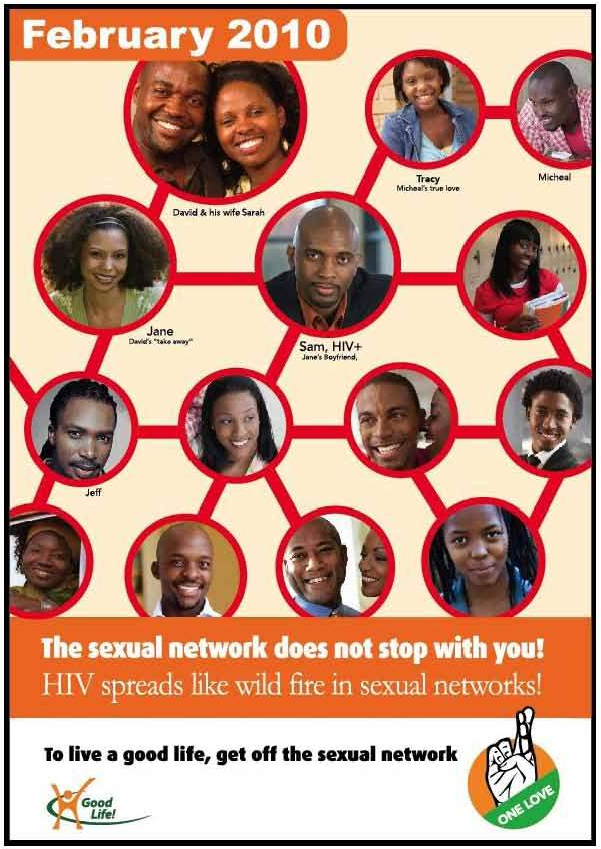
Uganda Health Marketing Group/Johns Hopkins Center for Communication Programs,
Challenges in measuring networks
- Defining a contact
- Bounding networks in time, space, etc.
- Missing data
- Measuring weighted and dynamic networks
- Personal information and ethical concerns
- Exploiting indirect information about networks
Eames, Bansal, Frost, Riley. Epidemics (2014)
Unlinked infections in HIV
- 9/15 (60%) and 18/26 (69%): contact tracing of two networks in Cuba
- 7/36 (19.4%): a trial to test whether early initiation of antiretroviral therapy reduces transmission
- 40/148 (27.0%): a trial to determine the efficacy of genital herpes suppression in reducing HIV-1 transmission
- 20/149 (13.4%): a cohort of discordant couples in Lusaka, Zambia.
Resik et al. 2007, Eshleman et al. 2011, Campbell et al. 2011, Trask et al 2002
Why?
- Many reasons for either intentional or unintentional reporting of network data
- Long infectious period
- Low infection probability per contact
- Possibly many contacts
- Stigma
Proxies
- We can think of the sexual network as nested within the social network
- Egocentric network measures
- Venues
- Respondent-driven sampling
- The transmission network is nested within the contact network
How many …?
- The degree of a node is a basic network measure
- Network scale-up method
- Asking how many individuals in a specific group someone knows
- Ask across multiple group types
- This approach can also be used to examine social networks by subpopulation
MeNS Network Study
- Priorities for Local AIDS Control Efforts (PLACE)
- Phase 1: identify key informants to identify venues
- Phase 2: interview staff of venues
- Phase 3: interview patrons of venues
- We used the PLACE protocol to study the role of bars, clubs, coffee shops, and other venues in structuring social, sexual, and drug-use networks in San Diego
w/Lydia Drumright, Sharon Weir
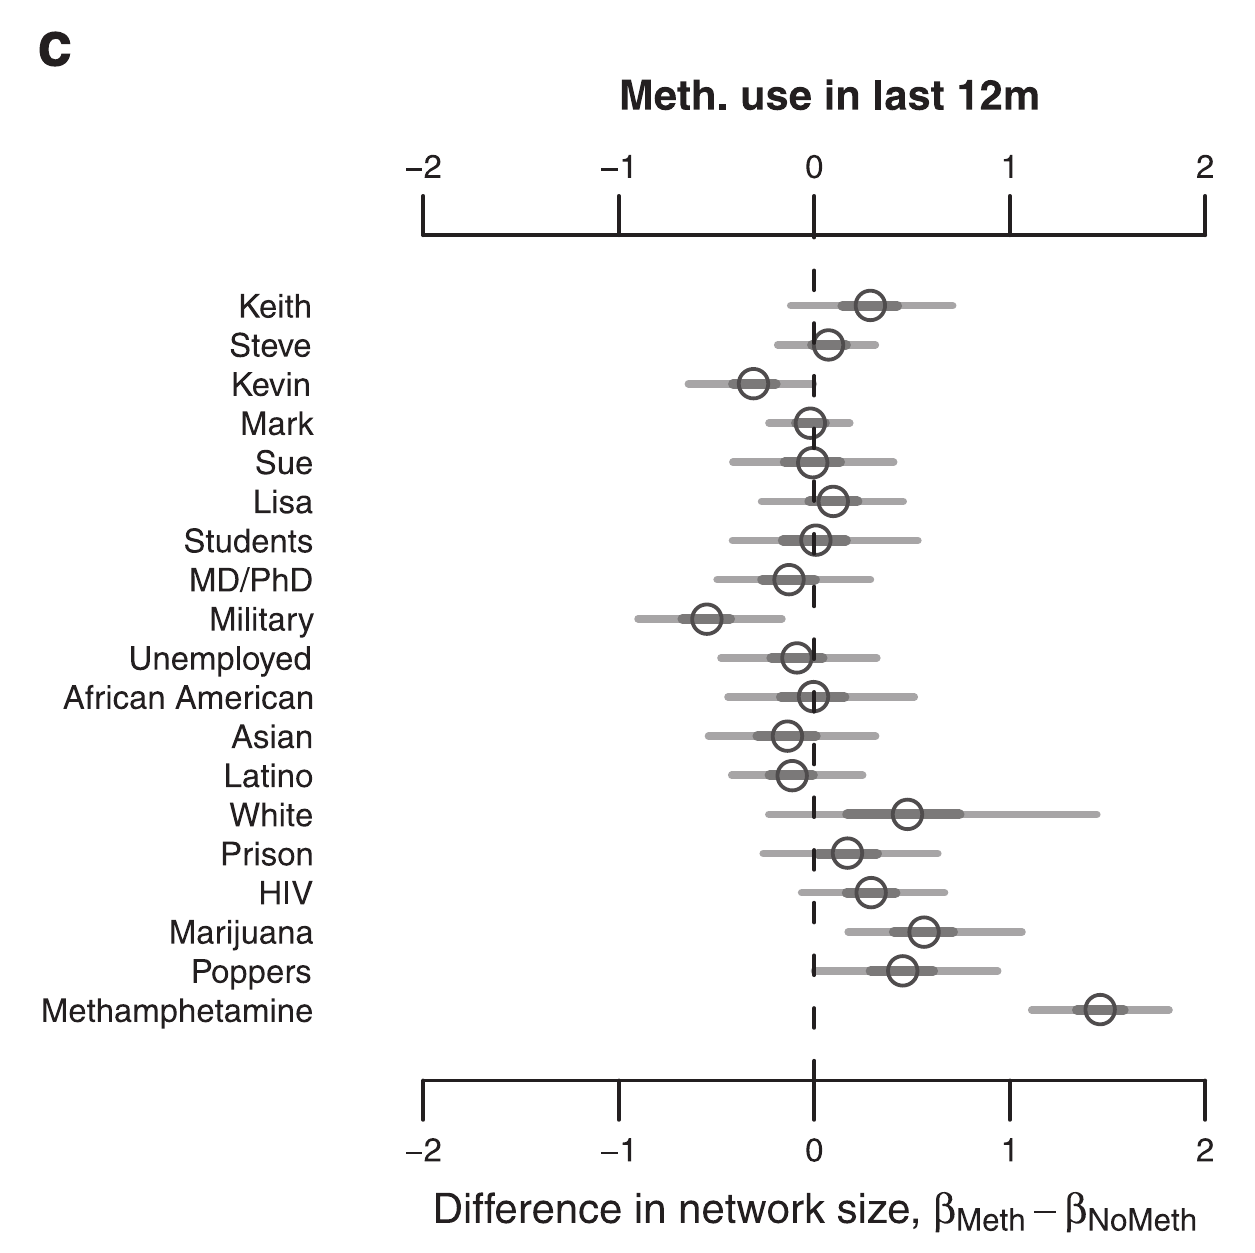
Network sizes
- We asked participants (n=609) to report network sizes
- Groups (k=19) included:
- Names
- Ethnicity
- HIV
- Past sexually transmitted infections (STIs)
- Methamphetamine use
- Network sizes were assumed to follow a negative binomial distribution with group- and individual-level means
Zheng et al. (2006)
Network size by HIV
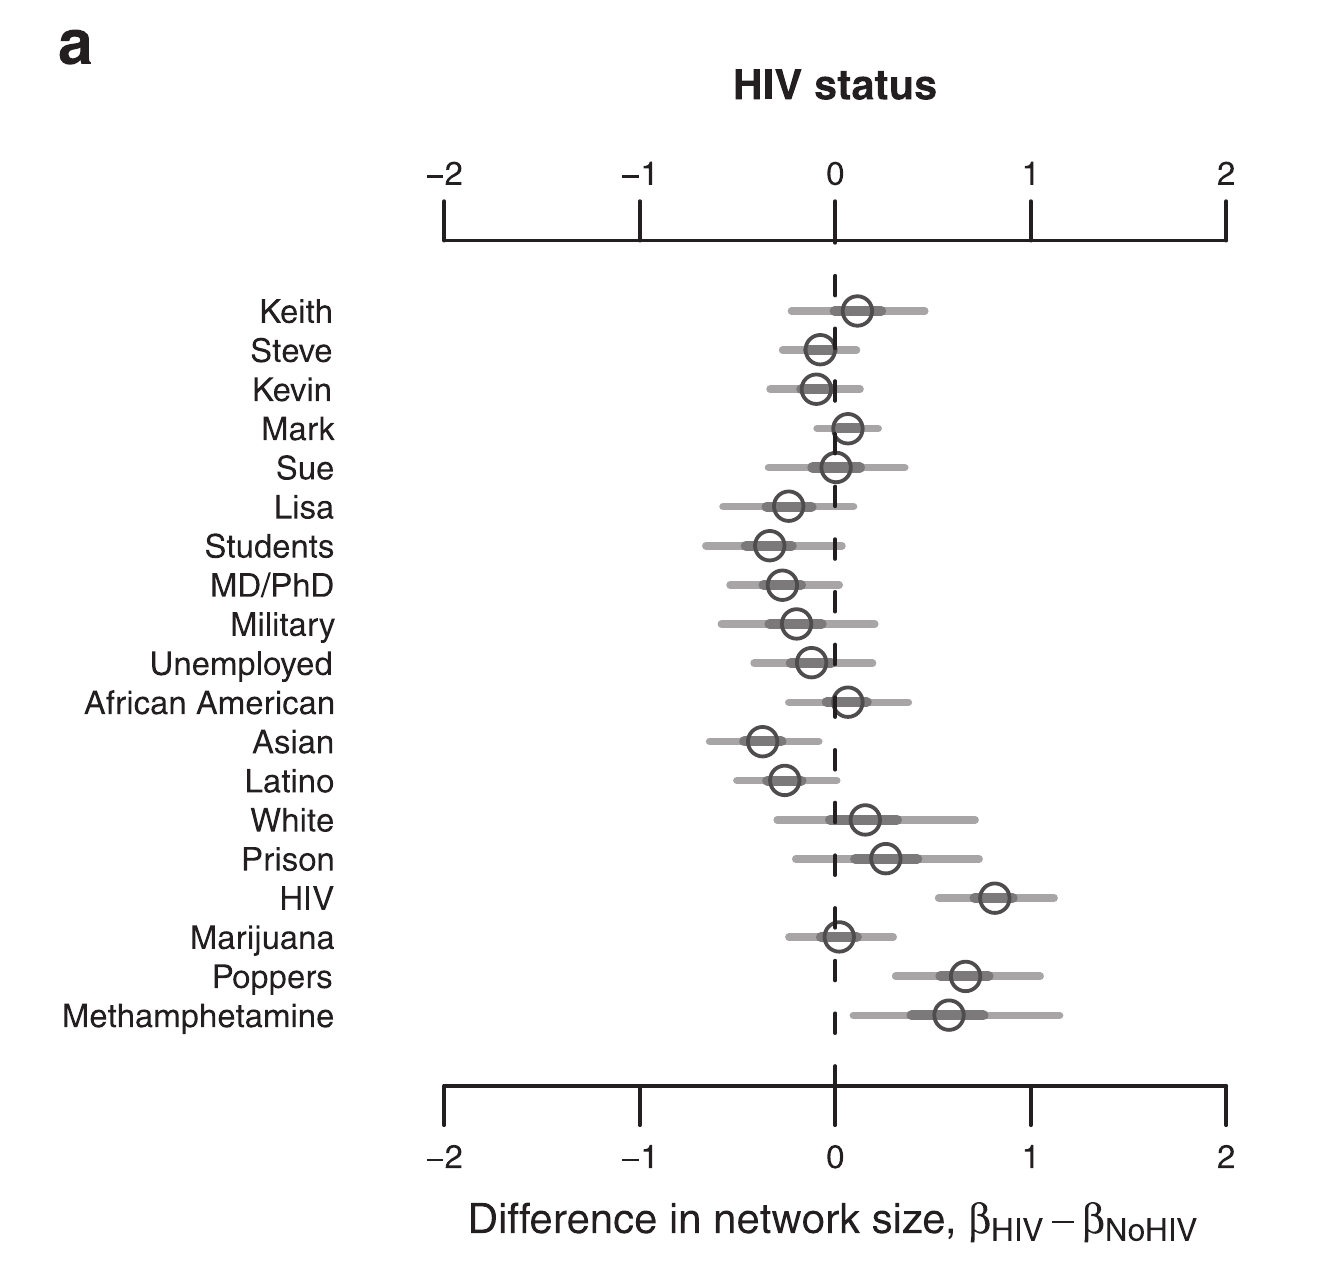
Drumright, Frost (2010)
Network size by HIV
Drumright, Frost (2010)
Venues
- Time-location sampling is widely used in HIV surveillance
- Information on the venues is often ignored or treated as a nuisance parameter
- Information on specific venues may give insights into risk networks
- Risky people
- Risky places
Venues and networks
- Venues may also structure contact networks
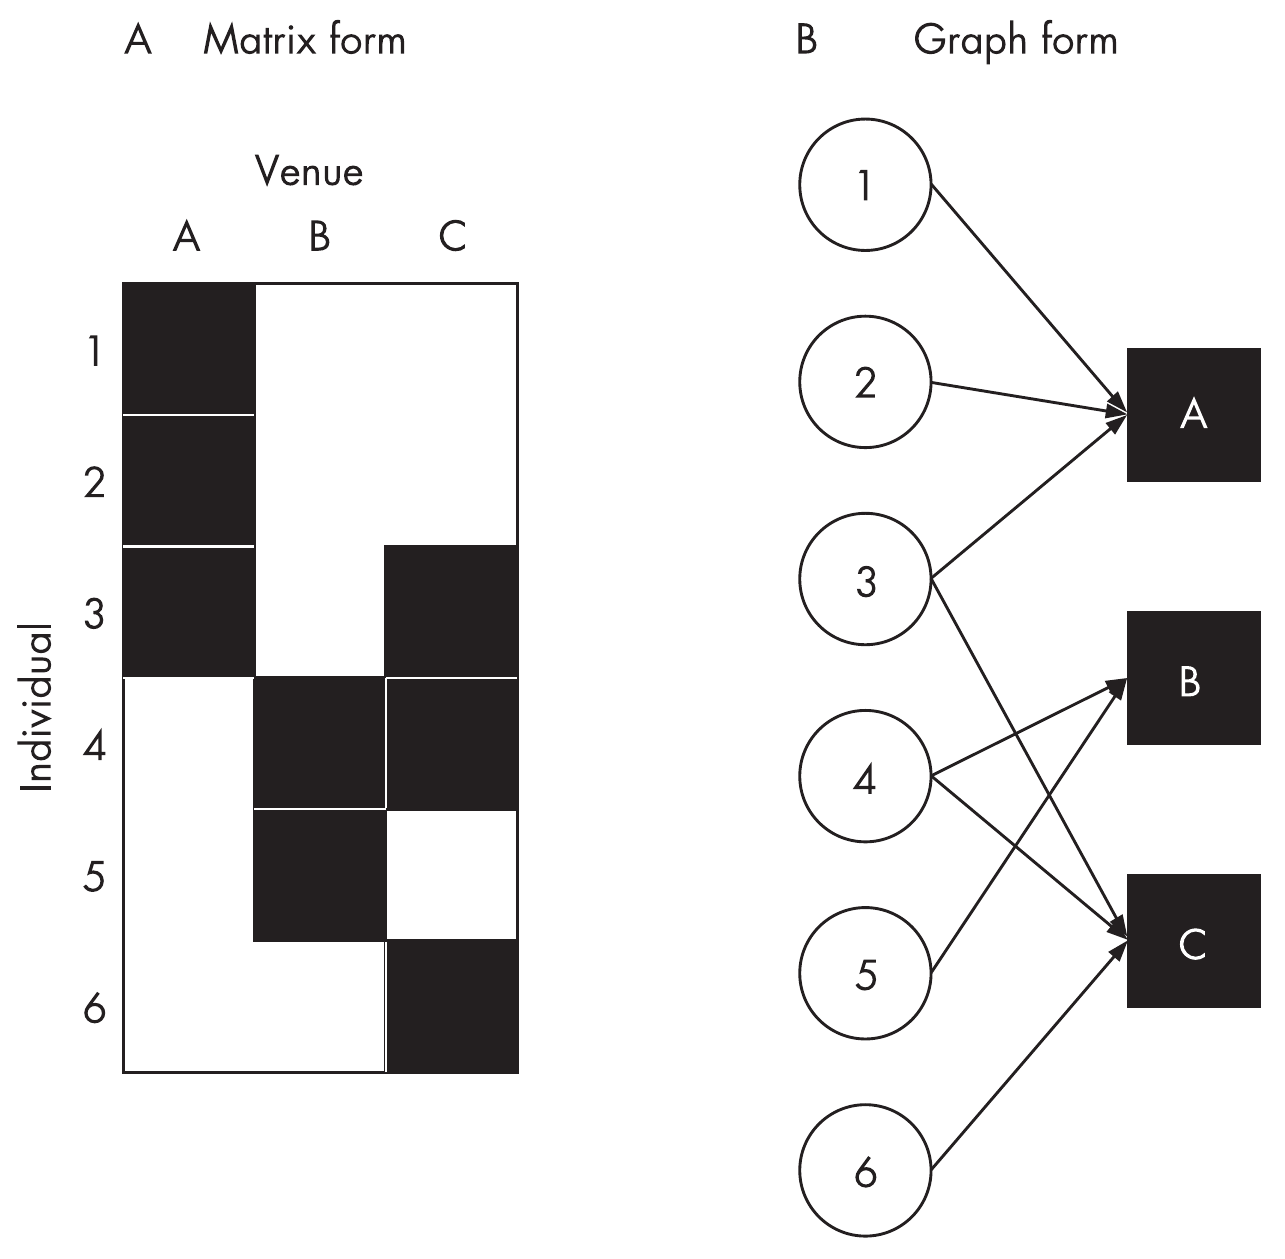
Frost (2007)
Venues in MeNS Network Study
- Venues stratify the population
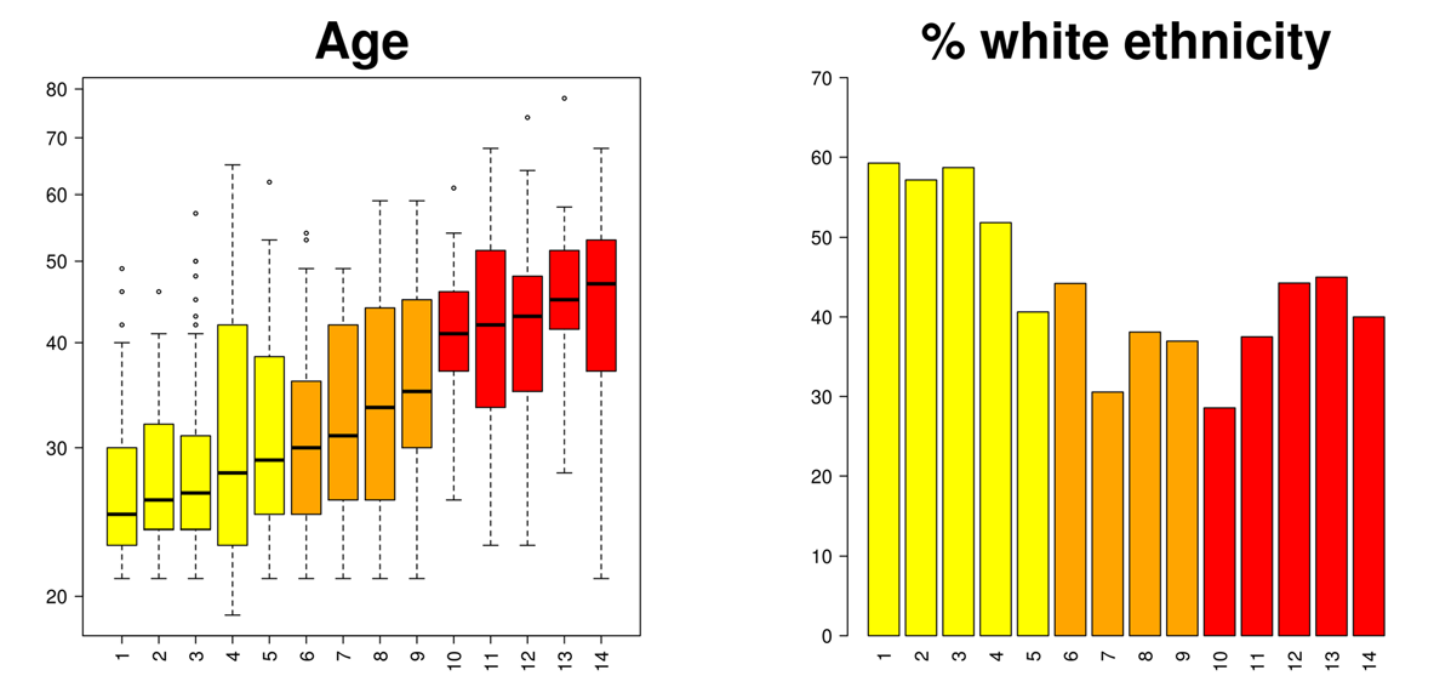
Drumright, Weir, Frost (2018)
Association with outcomes
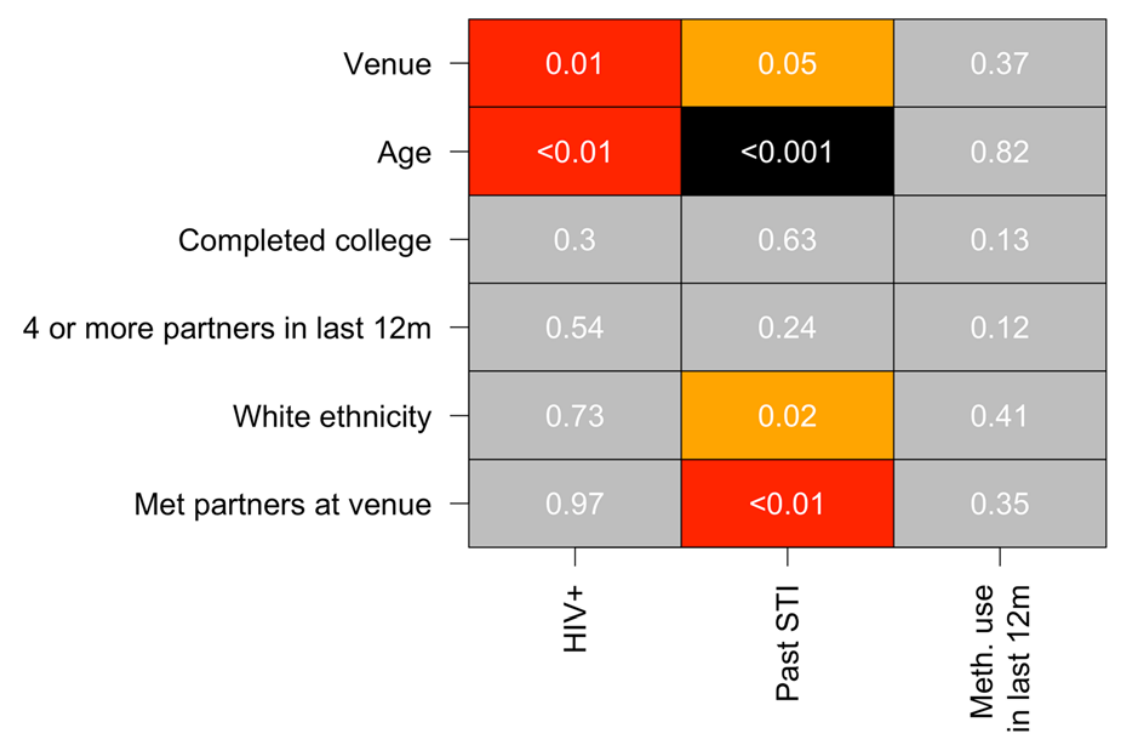
Drumright, Weir, Frost (2018)
Venues, HIV and STI
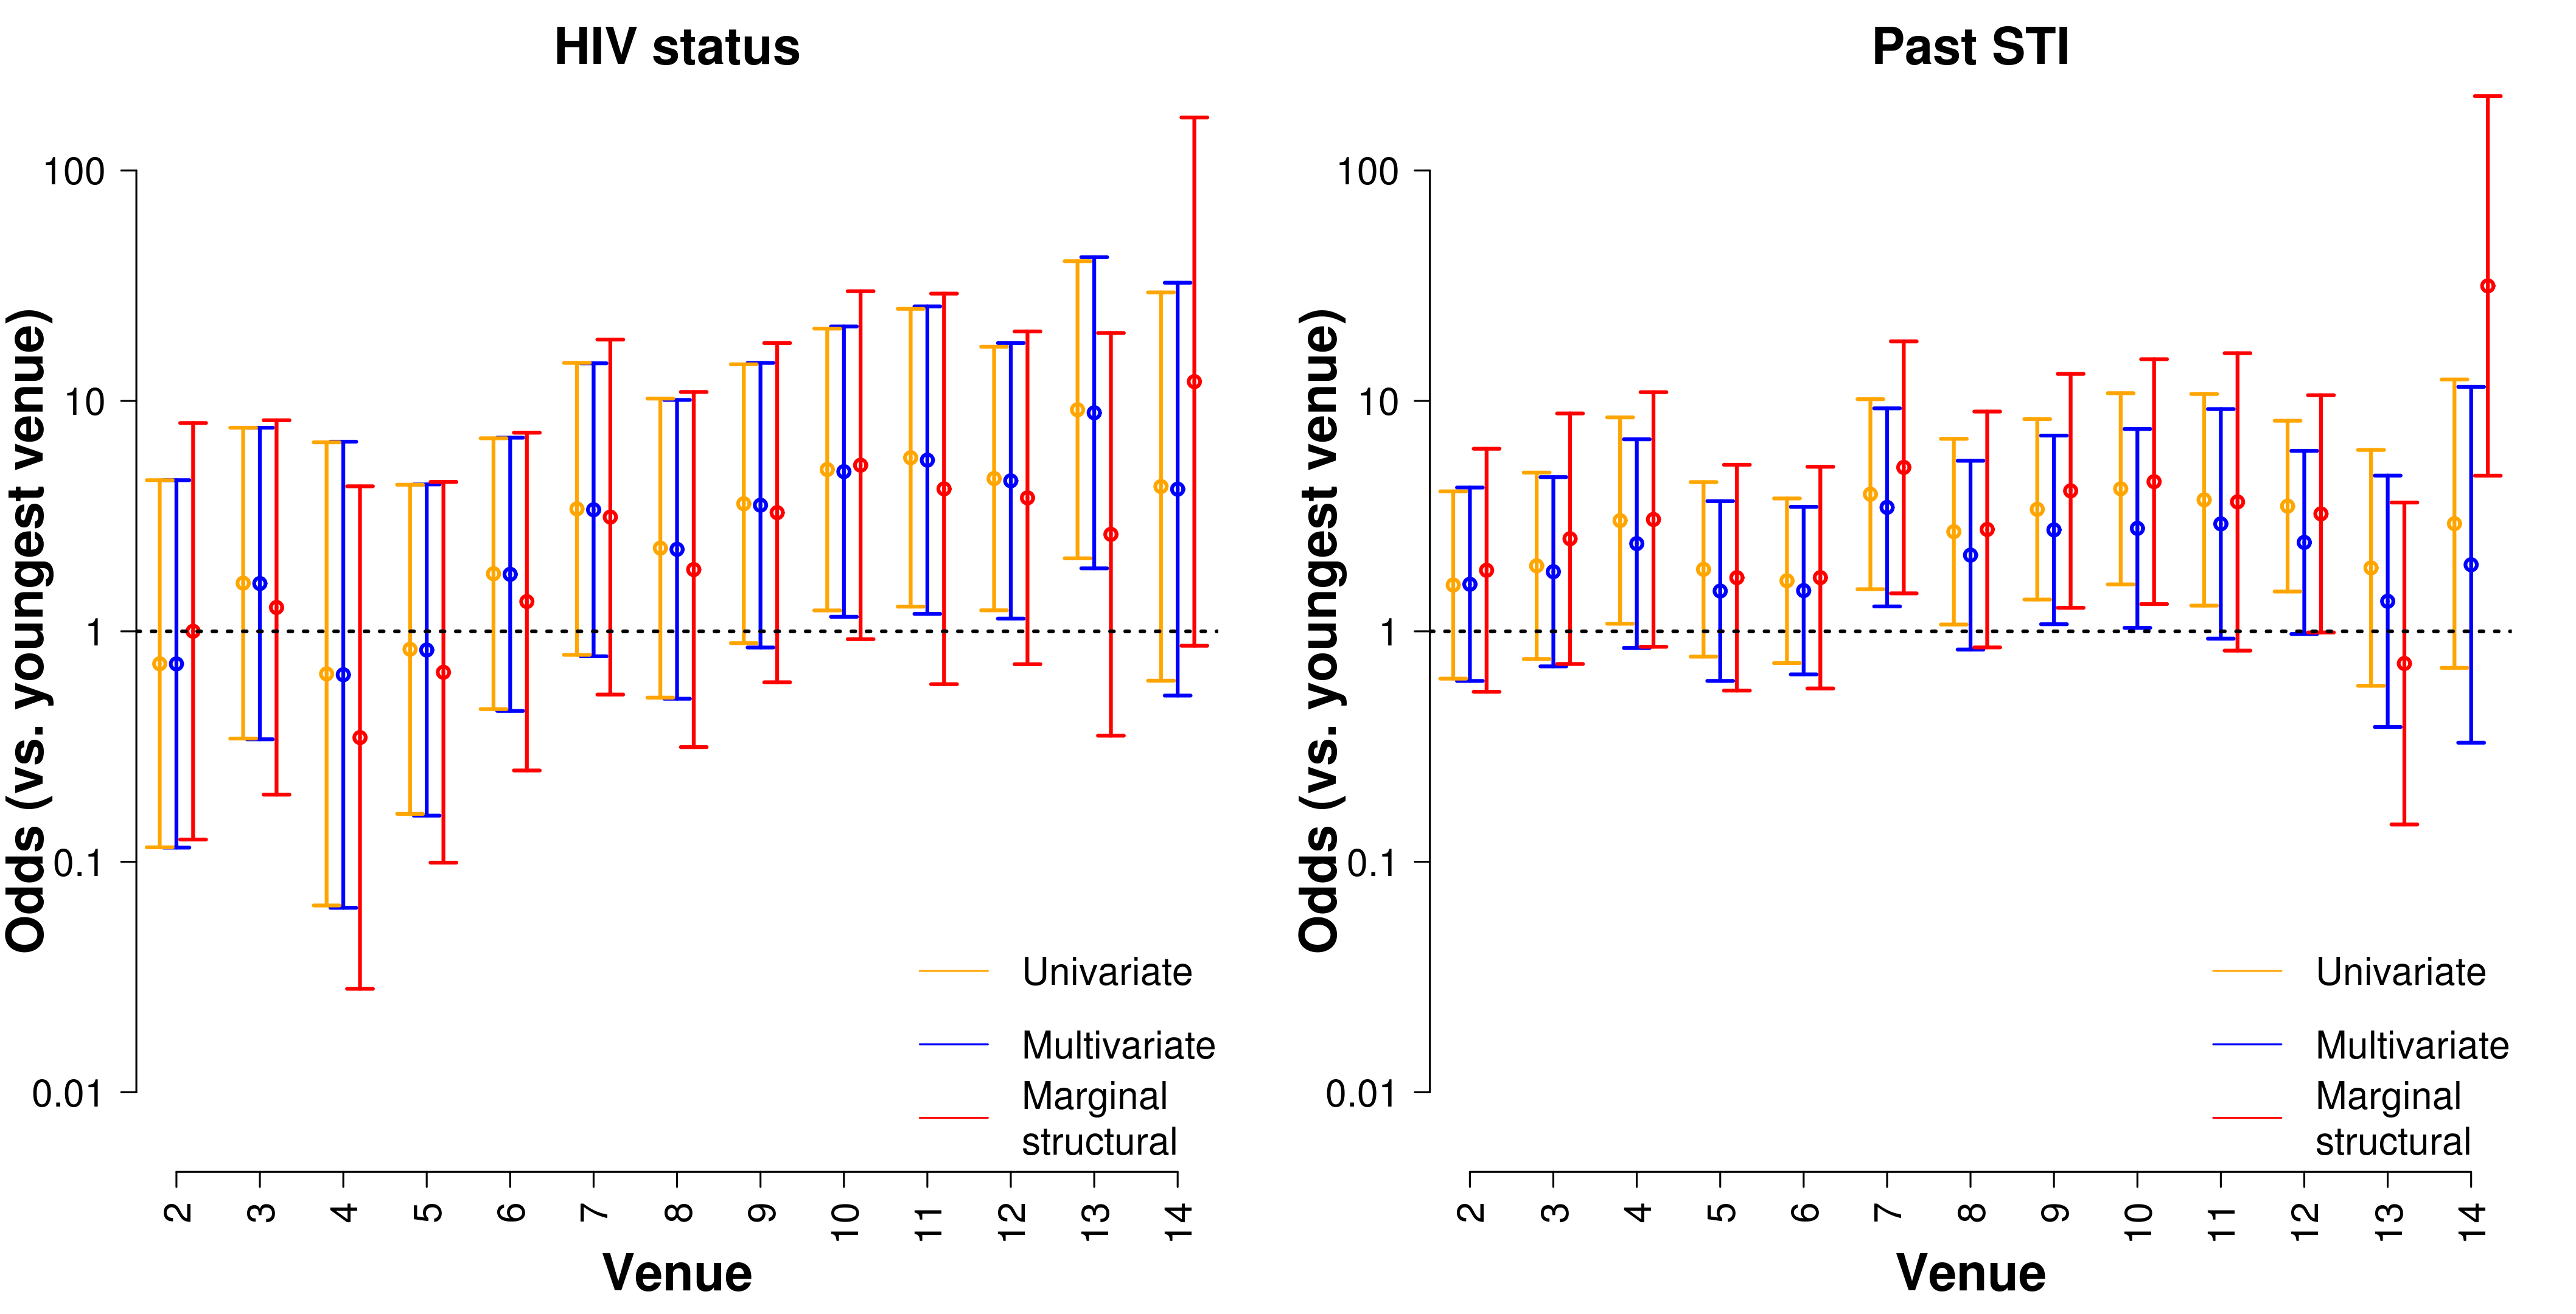
Drumright, Weir, Frost (2018)
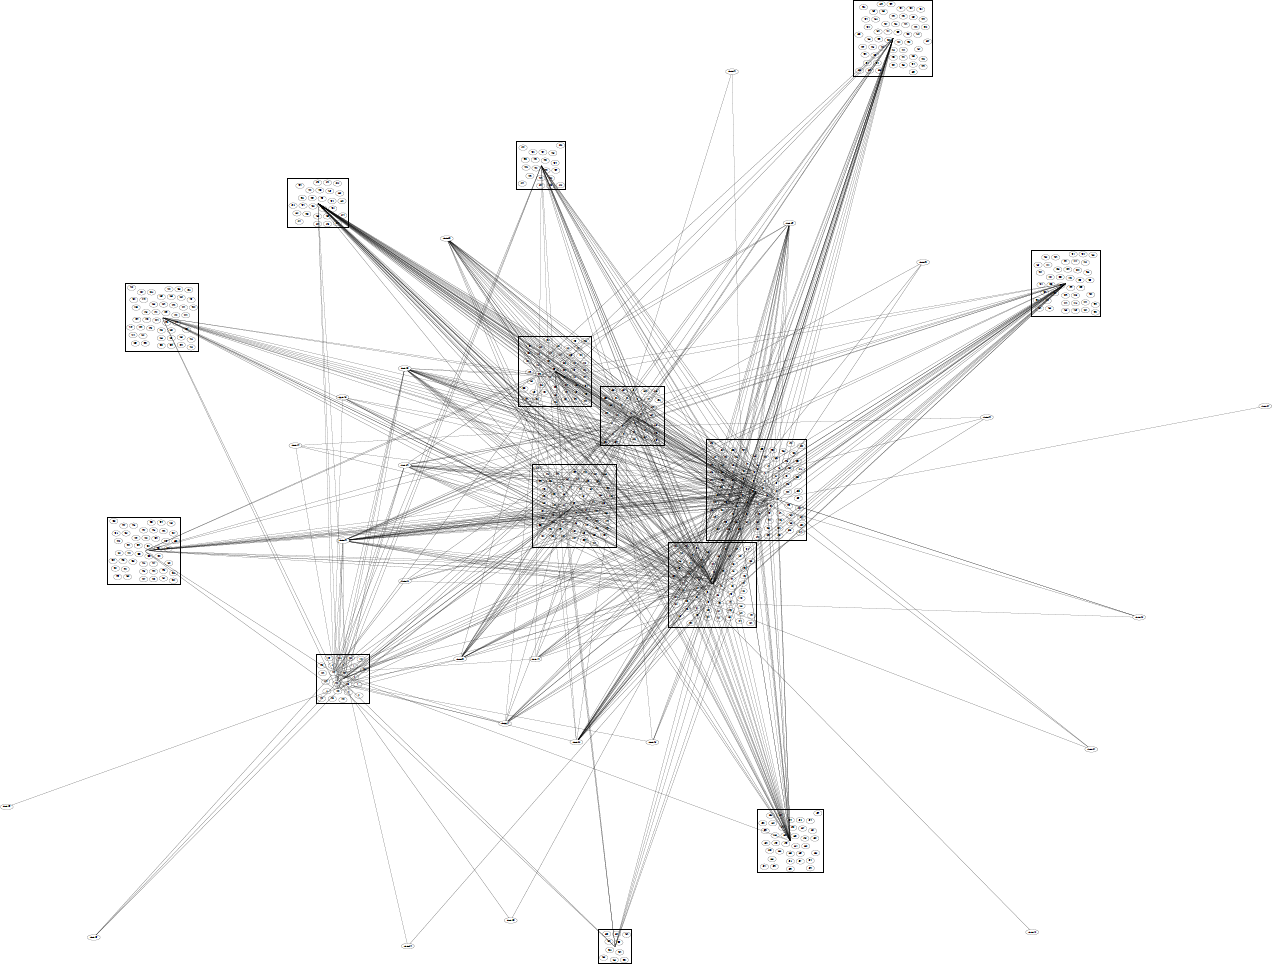
Network of venues
Alternative recruitment strategies
- Time-location sampling is common in HIV studies
- Relatively resource intensive
- Respondent-driven sampling is a popular method that harnesses peer referral networks
- Provides a rich, though hard to interpret, source of network data
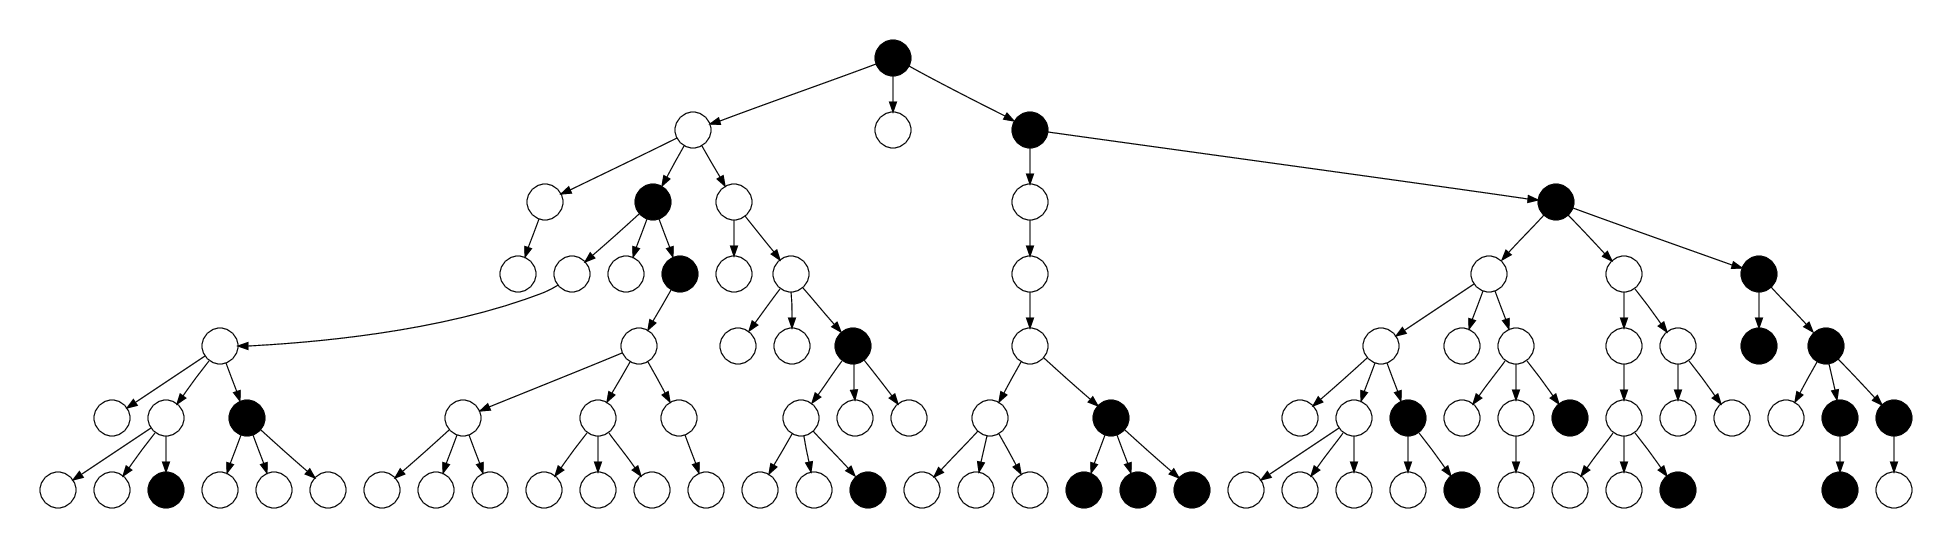
Respondent-driven sampling
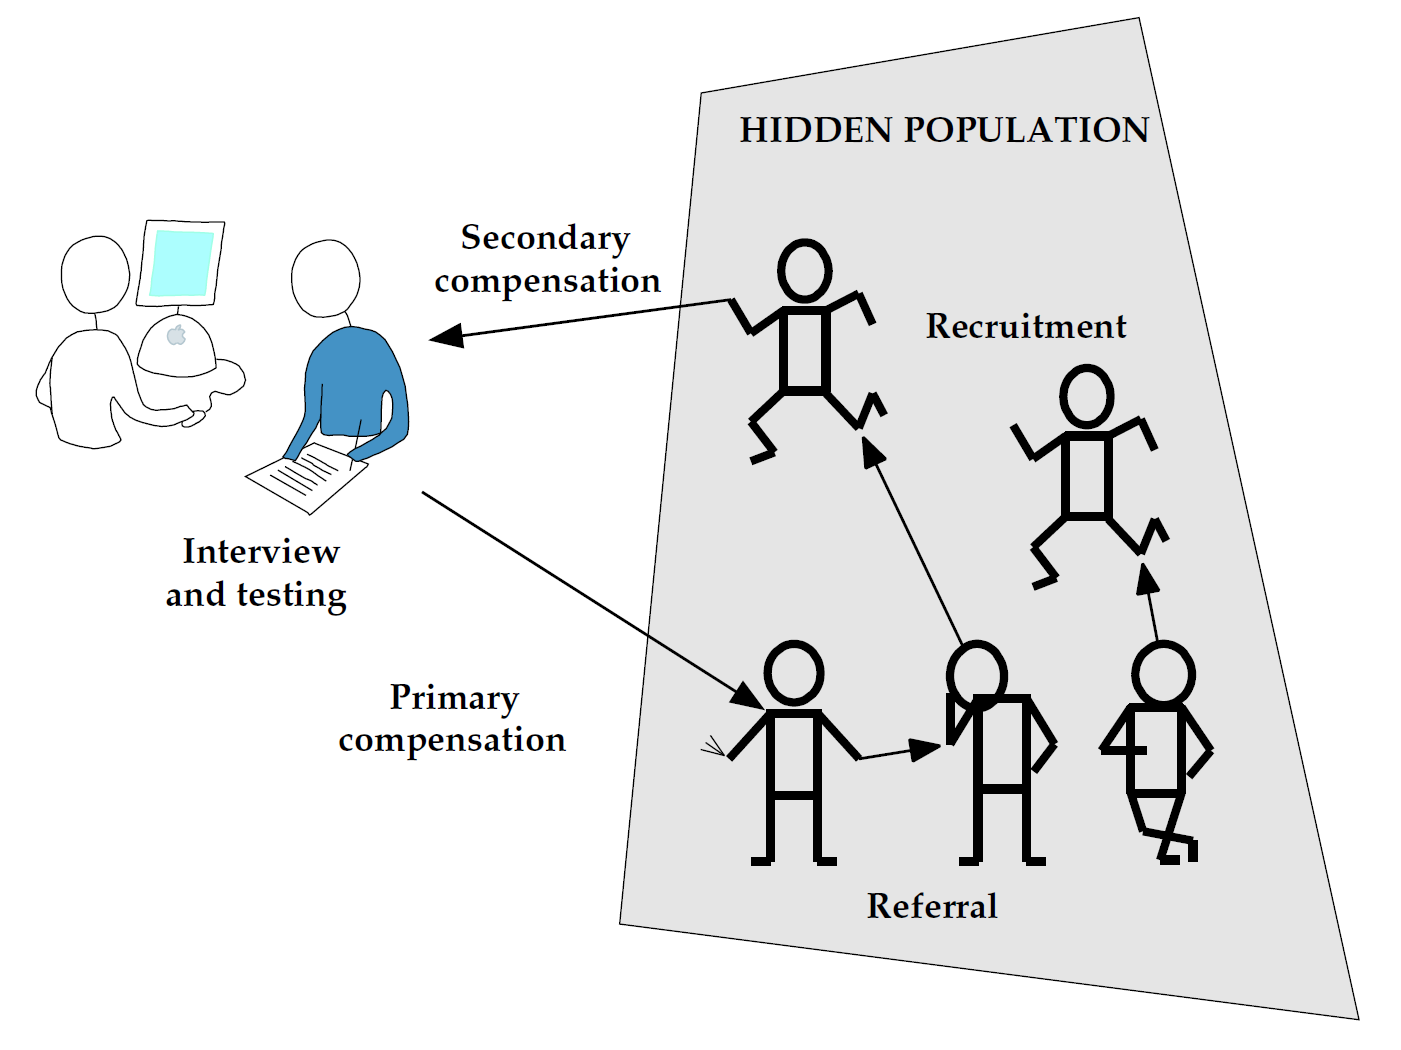
RDS produces trees
Recruitment proportional to degree
- RDS is often considered to be analogous to a random walk on a network
- Generates a random sample of edges rather than nodes
- Consequently, recruitment is proportional to degree
\[\begin{equation}
\widetilde{\pi_{i}} = \frac{d_i}{\sum_{j}d_j}
\end{equation}\]
- Under this model, unbiased estimates e.g. of disease prevalence can be obtained by inversely weighting by the degree
RDS as an epidemic
- What are the dynamics of recruitment of individuals with different degrees during RDS?
- Compare the dynamics on a static network with those where there is simply heterogeneity in degree, but with no local network structure
- ‘Random mixing’ model of Volz, Eur Phys J B (2008)
\[\begin{align}
\frac{d\theta(t)}{dt} & = -\beta \theta(t)+\beta\left(\frac{\psi'(\theta(t))}{\psi'(1)}+\gamma\left(1-\theta(t)\right)\right)\\
S(t) & = \psi(\theta(t))\\
I(t) & = 1-S(t)-R(t)\\
\frac{dR(t)}{dt} & = \gamma I
\end{align}\]
Dynamics with Poisson-distributed degree, mean 5

Predictions of RDS
- Individuals with higher degrees should be recruited more rapidly
- What if:
\[\begin{equation}
\widetilde{\pi_{i}} = \frac{d_i^{\tilde{\theta}}}{\sum_{j}d_j^{\tilde{\theta}}}.
\end{equation}\]
- \(\tilde{\theta}\), the ‘coefficient of discoverability’
- \(\tilde{\theta}=1\) corresponds to the standard RDS assumption
- \(\tilde{\theta}=0\) corresponds to sampling being independent of degree
Estimates from real datasets
| Uganda |
0.35 |
| Cornell WebRDS |
0.05 |
| Pakistani immigrants |
0.53 |
| Jazz musicians in NYC |
0.51 |
- Recruitment rates are neither simply proportional to degree, nor independent of degree
Homophily
- RDS can also provide information on homophily
- Project FLOW
- Between August 2005 and January 2007, RDS was used to recruit 449 individuals (25 seeds, 424 recruits)
- Men who have sex with men and/or
- Drug users (used methamphetamine, cocaine and/or heroin) in Los Angeles, California
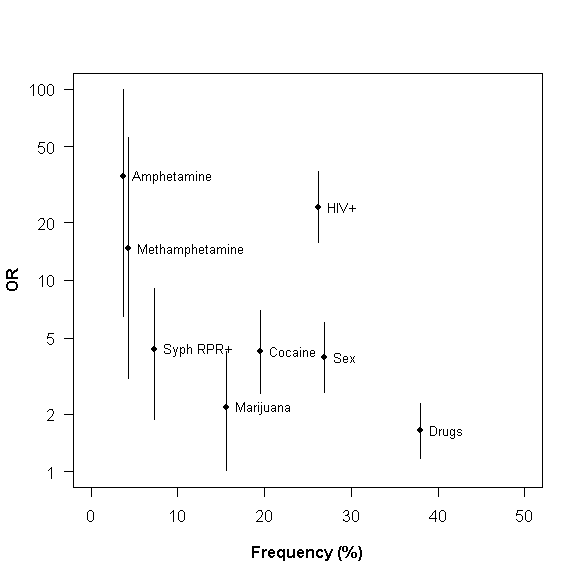
- Individuals were tested for HIV, and asked whether they had sex with their recruiter
RDS tree

Homophily in Project FLOW
Transmission
- Transmission occurs over the contact network, and so may contain at least some information on the contact network
- For acute infection, the time of onset of infection can help infer transmission
- For recurrent infection, information on first and subsequent infection can be informative
- For rapidly evolving pathogens, sequence data can provide information
- Trees
- Networks in the presence of pathogen recombination
Time between measles infections in households
Klinkenberg and Nishiura (2011)
Harnessing sequence data
- Sequence data can tell us about the transmission network, which may inform us about the contact network
- Allows us to ask what could have happened
- Many challenges in harnessing sequence data
- Frost et al. Epidemics (2014)
- Approaches to using sequence data to look at population structure:
- In the top down approach, we compute measures on the tree, and ask whether population structure might have generated the observed patterns
Measures of imbalance

Asymmetry in a HIV sample from a London hospital

Measure of assortativity

A ‘core group’ model of HIV
\[
\begin{align}
\frac{dS_1(t)}{dt} & = \Lambda_1 -S_1(t)\left(\beta c_1 p_{11} \frac{I_1(t)}{N_1(t)} + \beta c_1 p_{12} \frac{I_2(t)}{N_2(t)}\right) - \mu S_1(t)\\
\frac{dI_1(t)}{dt} & = S_1(t)\left(\beta c_1 p_{11} \frac{I_1(t)}{N_1(t)} + \beta c_1 p_{12} \frac{I_2(t)}{N_2(t)}\right) - (\mu+\gamma)I_1(t)\\
\frac{dS_2(t)}{dt} & = \Lambda_2 -S_2(t)\left(\beta c_2 p_{21} \frac{I_1(t)}{N_1(t)} + \beta c_2 p_{22} \frac{I_2(t)}{N_2(t)}\right) - \mu S_2(t)\\
\frac{dI_2(t)}{dt} & = S_2(t)\left(\beta c_2 p_{21} \frac{I_1(t)}{N_1(t)} + \beta c_2 p_{22} \frac{I_2(t)}{N_2(t)}\right) - (\mu + \gamma)I_2(t)\\
\end{align}
\]
A model of mixing
- We consider a mixture of (a) preferential within-group mixing and (b) proportionate mixing using a parameter \(\rho_i\)
\[
\begin{align}
p_{ii} & = \rho_i + \left(1-\rho_i\right)\frac{c_i(1-\rho_i)N_i}{\sum_k c_k (1-\rho_k)N_k}\\
p_{ij} & = \left(1-\rho_i\right)\frac{c_j(1-\rho_j)N_j}{\sum_k c_k (1-\rho_k)N_k}
\end{align}
\]
Core groups can lead to asymmetric trees

Frost and Volz (2013)
Bottom up vs. top down
- Top down approaches are statistically well developed, however:
- Blunt instrument
- Difficult to integrate individual level data
- Bottom up approaches are better suited in this regard
Networks
- We are often interested in networks of infection
- Sequences do not directly provide information on who infected whom
- Loss of directionality
- In many cases, we have not sampled all the individuals in the transmission network
Loss of direction

Volz and Frost (2013)
‘Invisible’ transmissions

Volz and Frost (2013)
‘Transmission networks’ from phylogenies
Leigh Brown et al. (2011)
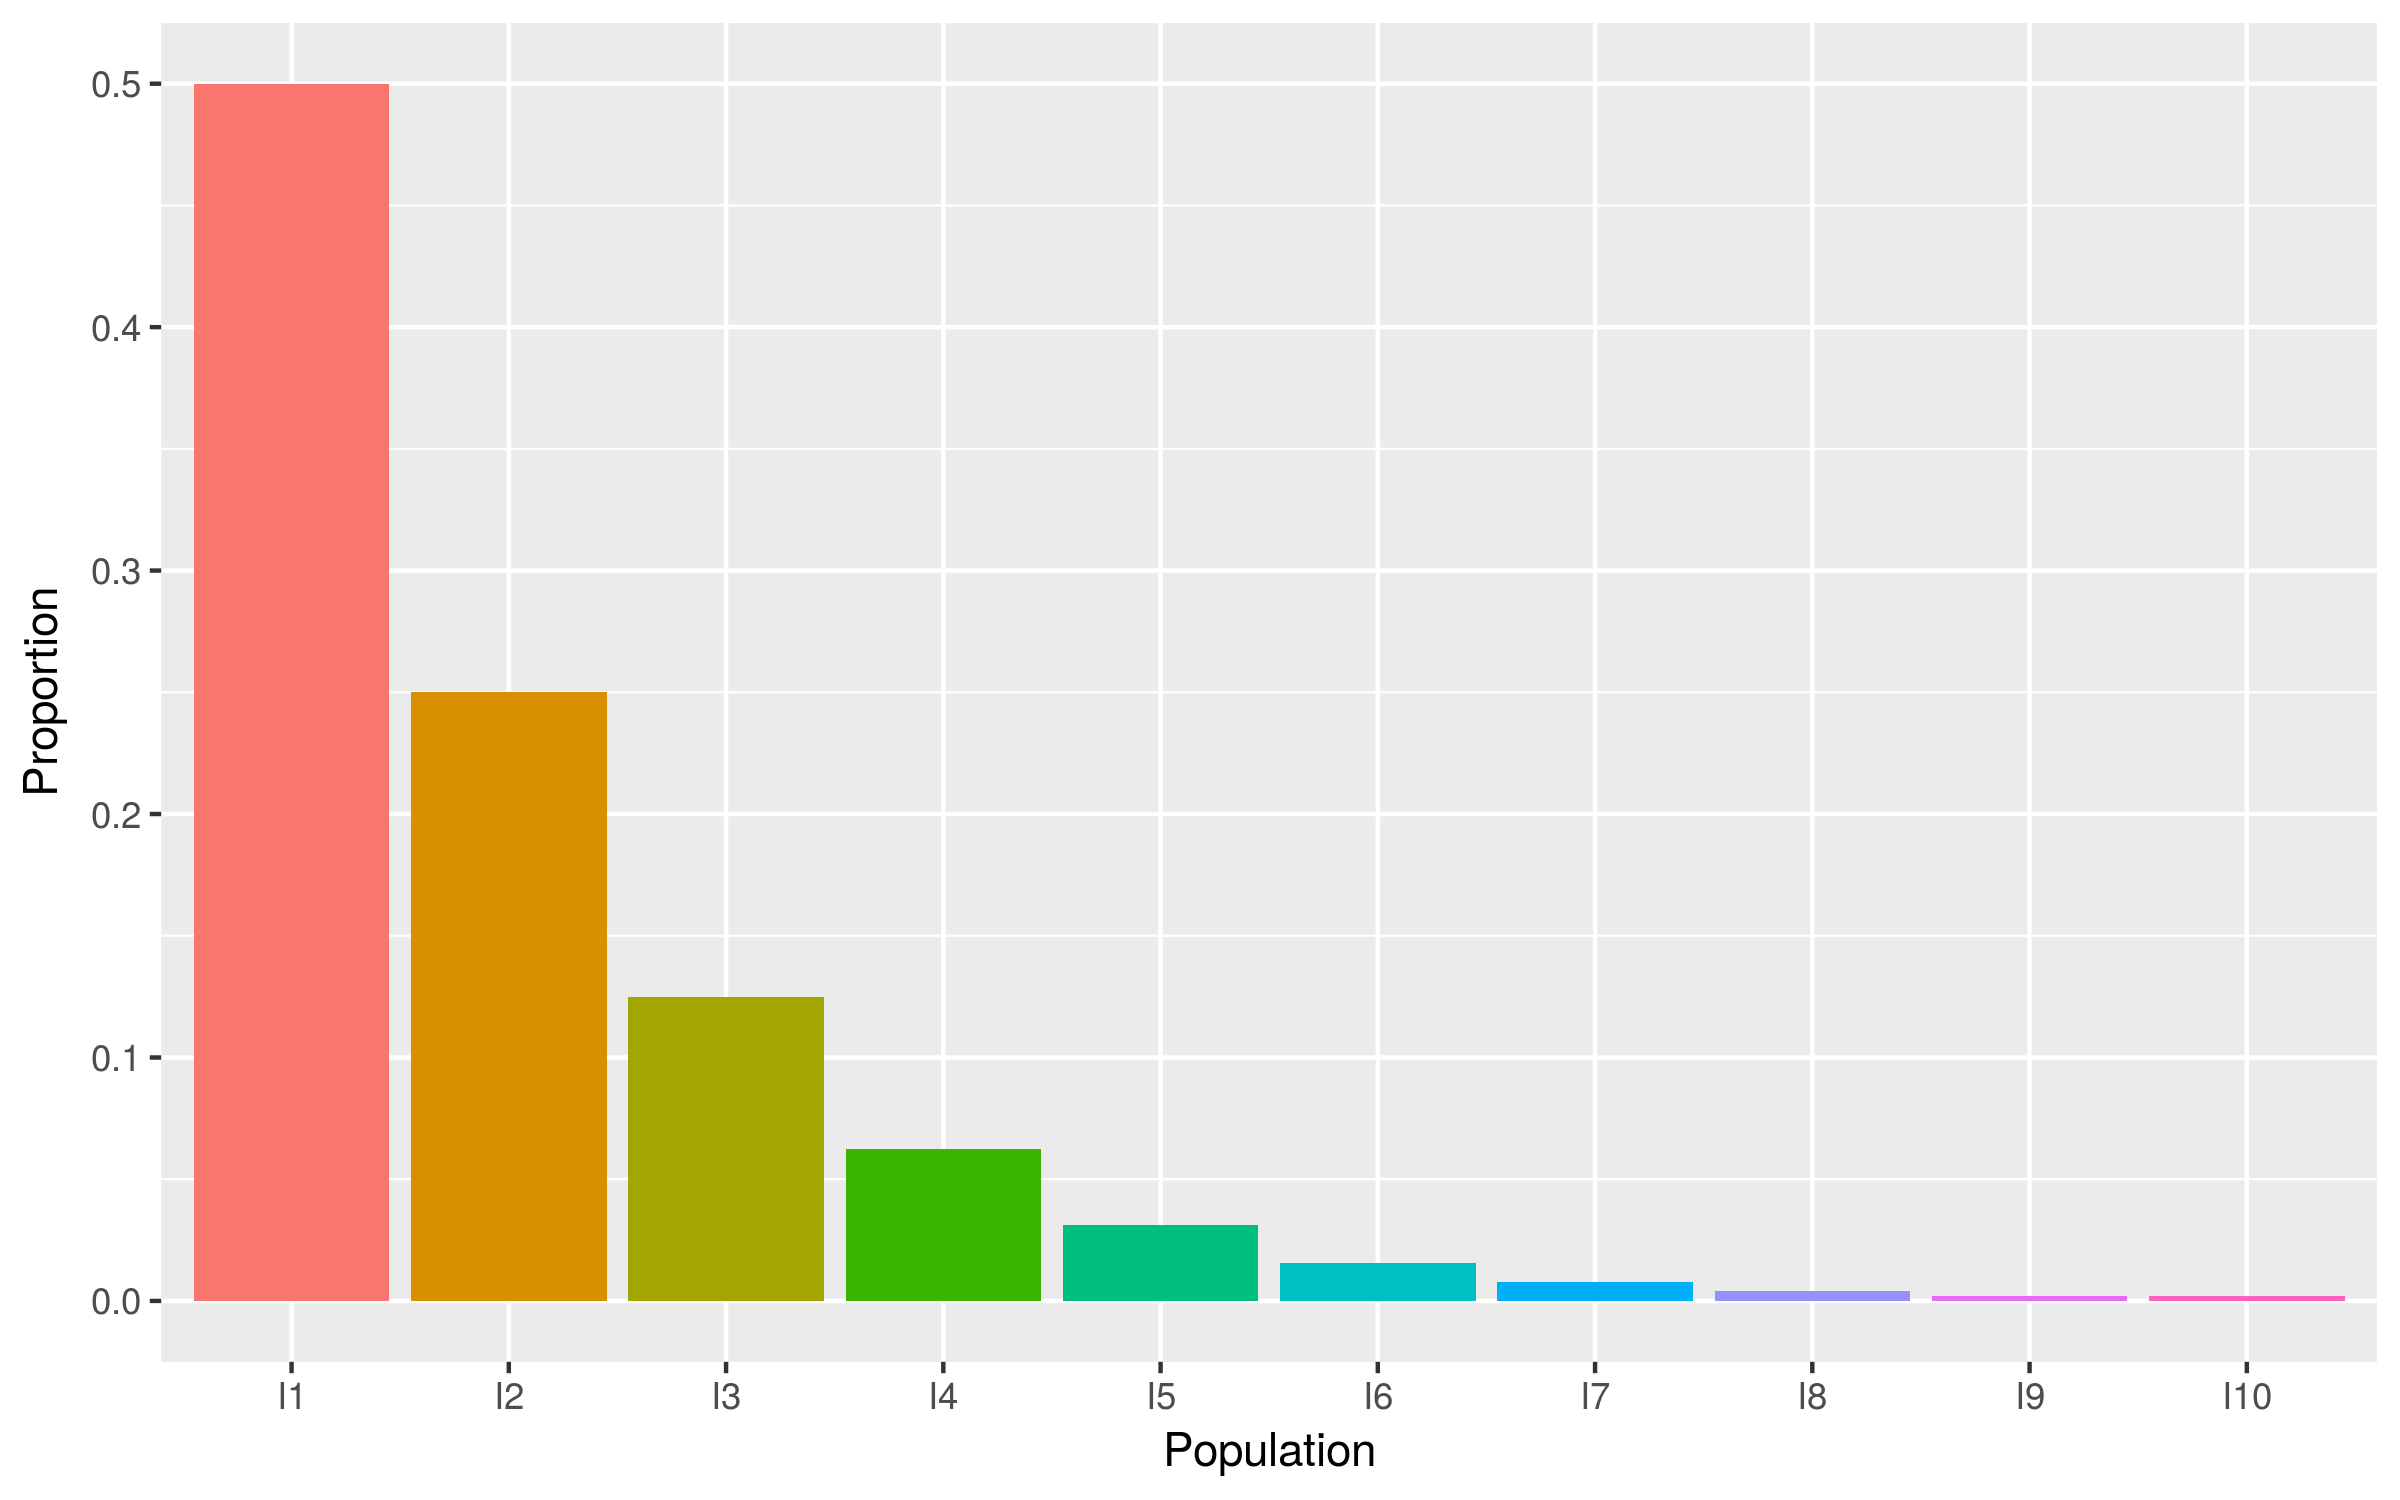
Power law degree distribution
Leigh Brown et al. (2011)
Counting infections
- Let us consider a simple ‘SIR’ type epidemiological model in which we count the number of times an individual has infected another
- No intrinstic differences between individuals
- In the absence of infection, what is the degree of the transmission network?
- Can we infer who has and who has not infected other individuals?
A model
\[
\begin{align}
\frac{dS}{dt} & = -\beta S \Sigma_i I_i\cr
\frac{dI_1}{dt} & = \beta S \Sigma_i I_i - \gamma I_1 - \beta S I_1\cr
\frac{dI_i}{dt} & = \beta S I_{i-1} - \gamma I_i - \beta S I_i\cr
\frac{dI_N}{dt} & = \beta S I_{N-1} - \gamma I_N\cr
\end{align}
\]
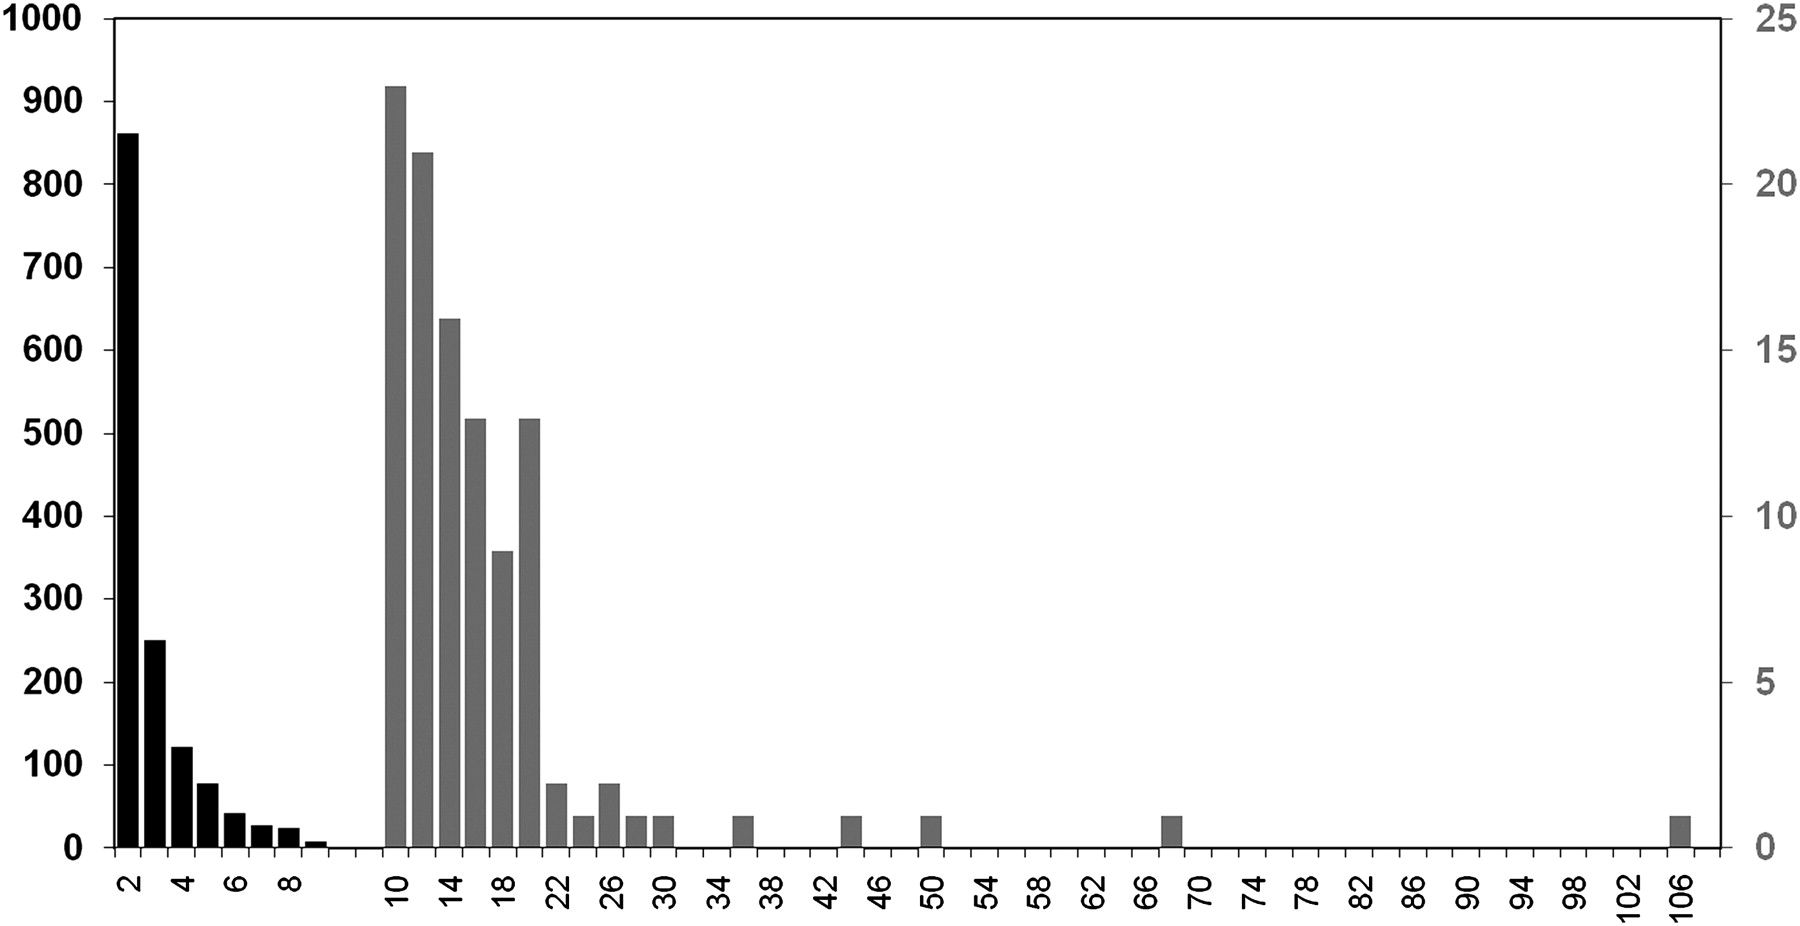
Degree distribution is geometric
- Half of individuals at any one time have not (yet) infected anyone
Consequences
- Due to the natural asymmetry in trees, we cannot draw strong conclusions from the degree of a network
- Strongly confounded by time since infection
- We can, however, compare different groups of individuals, allowing us to integrate individual-level data with sequence data
- Better if we can control for time since infection
- Only works with high levels of sampling
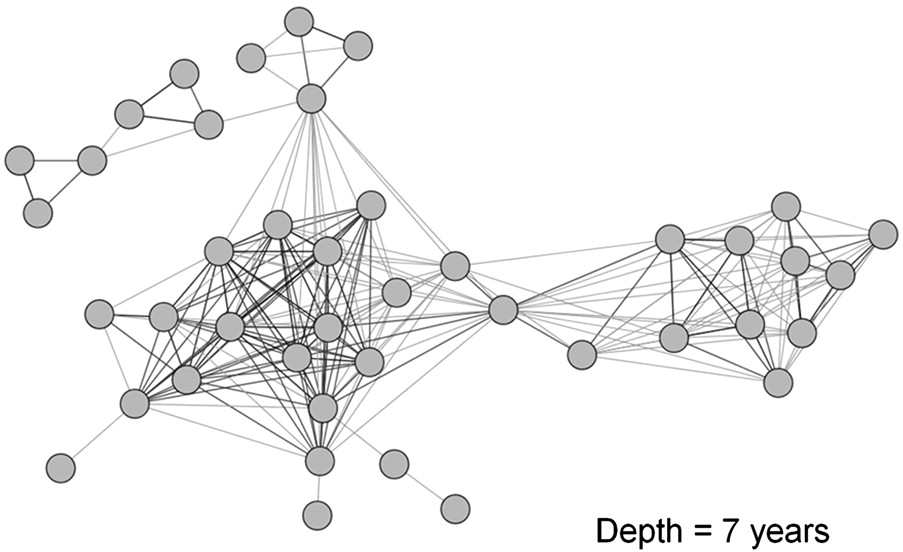
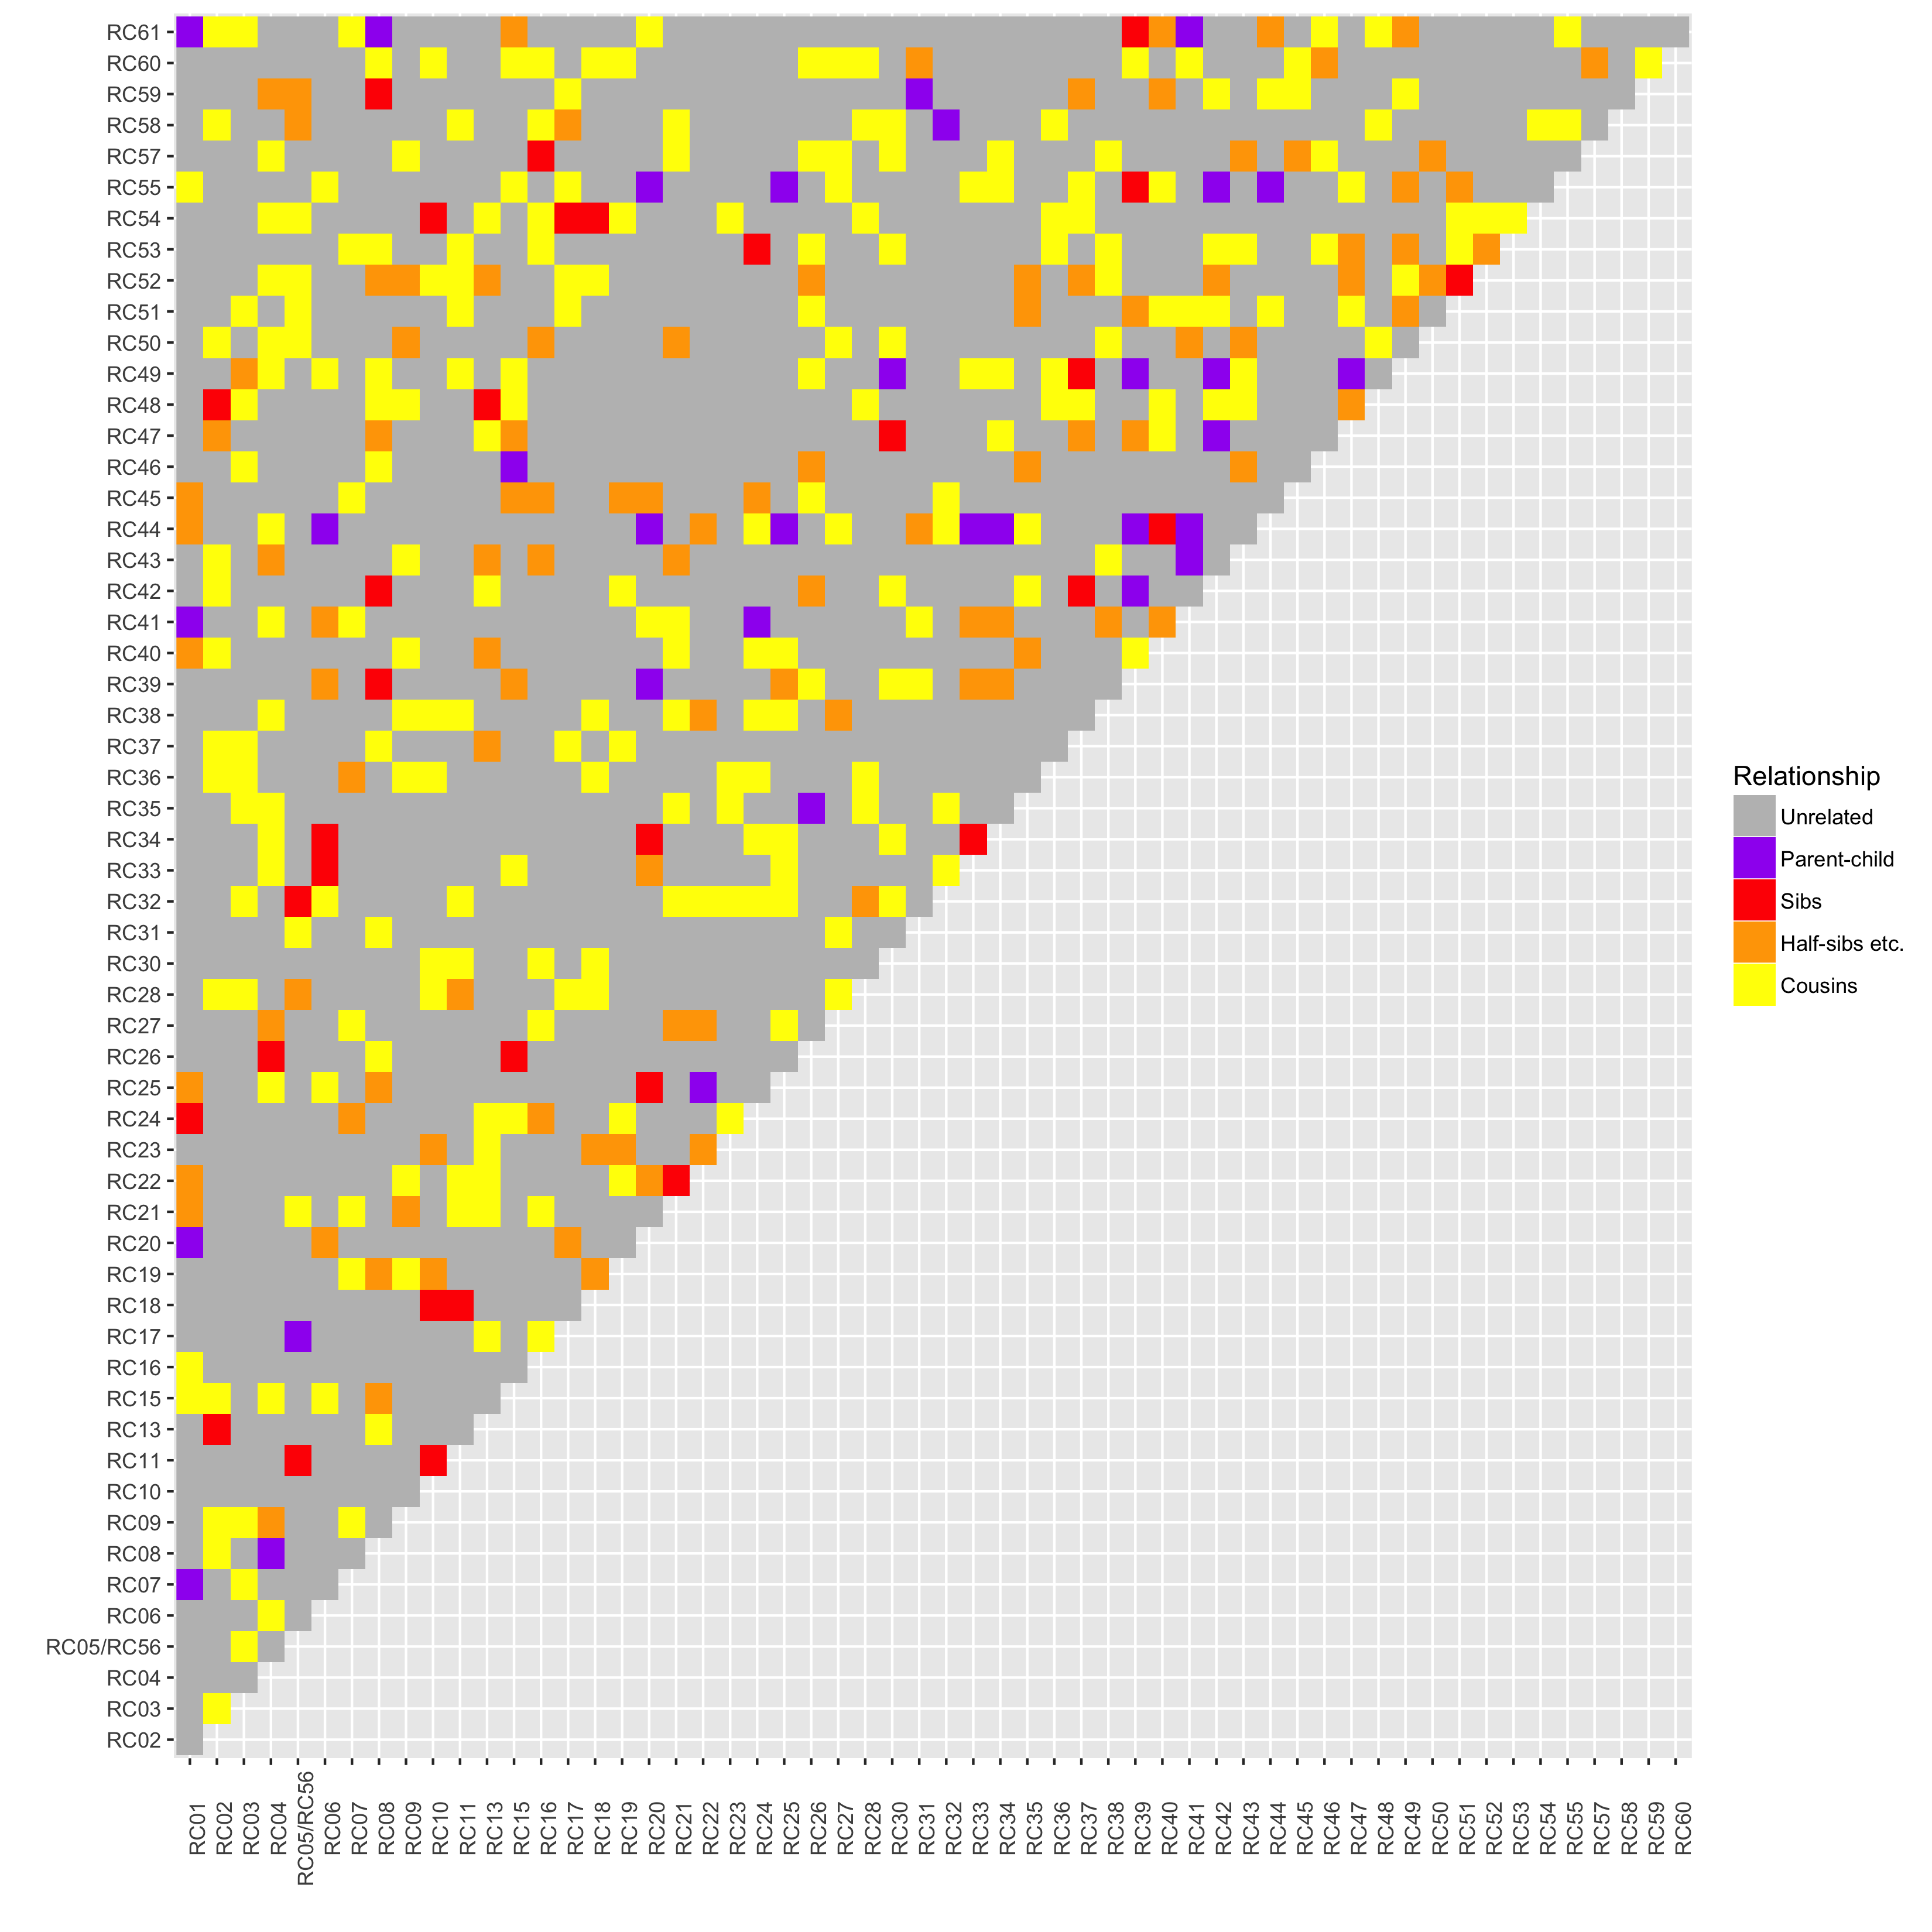
Example: red colobus in Uganda
Data
- Individual-level
- Network-level
- Pairwise interactions (aggressive, grooming, etc.)
- Biological
- Host microsatellite data
- Viral sequence data
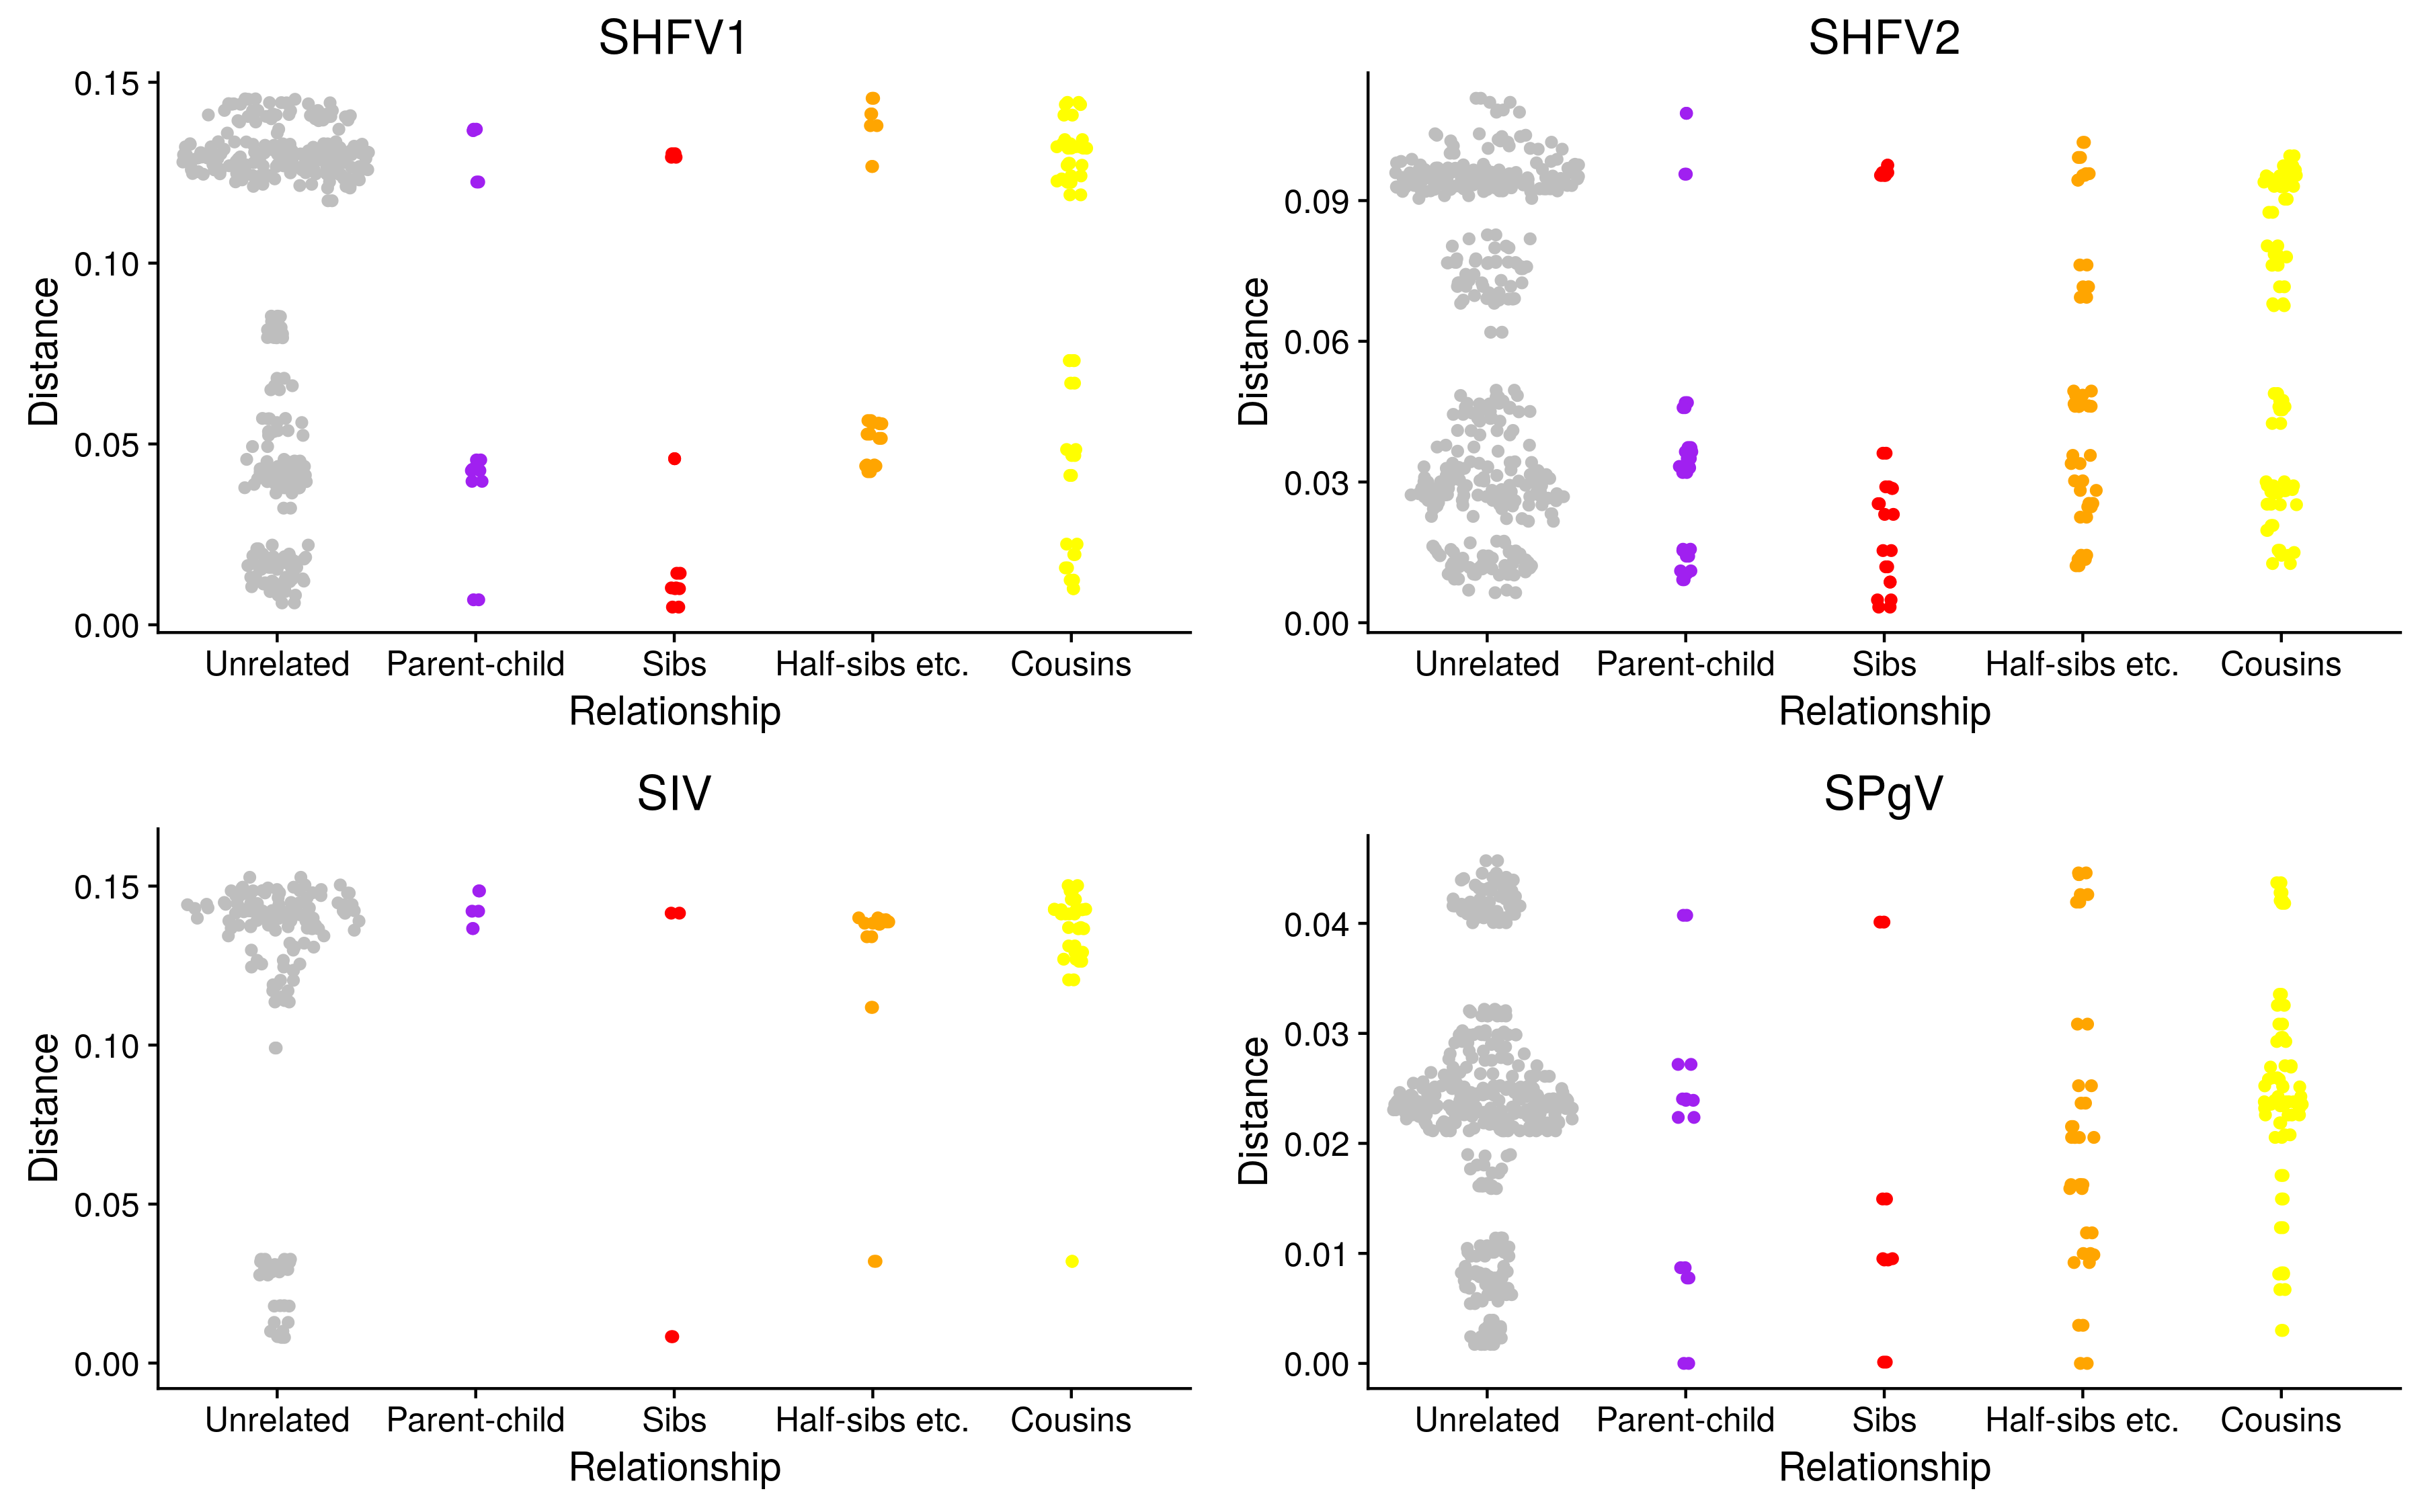
Viruses
- Multiple, co-circulating viral infections
- Retroviruses:
- Simian immunodeficiency virus (SIV)
- Simian T-cell lymphotropic virus (STLV)
- Simian foamy virus (SFV)
Other RNA viruses:
- Simian haemorrhagic fever virus (SHFV1, SHFV2)
- Simian pegivirus (SPgV)
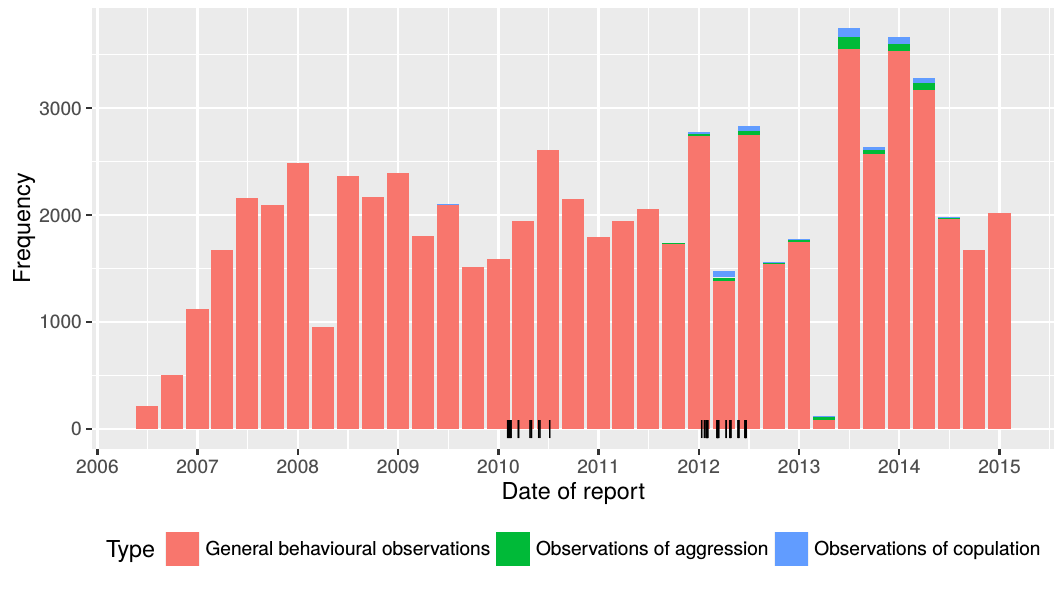
Social network data
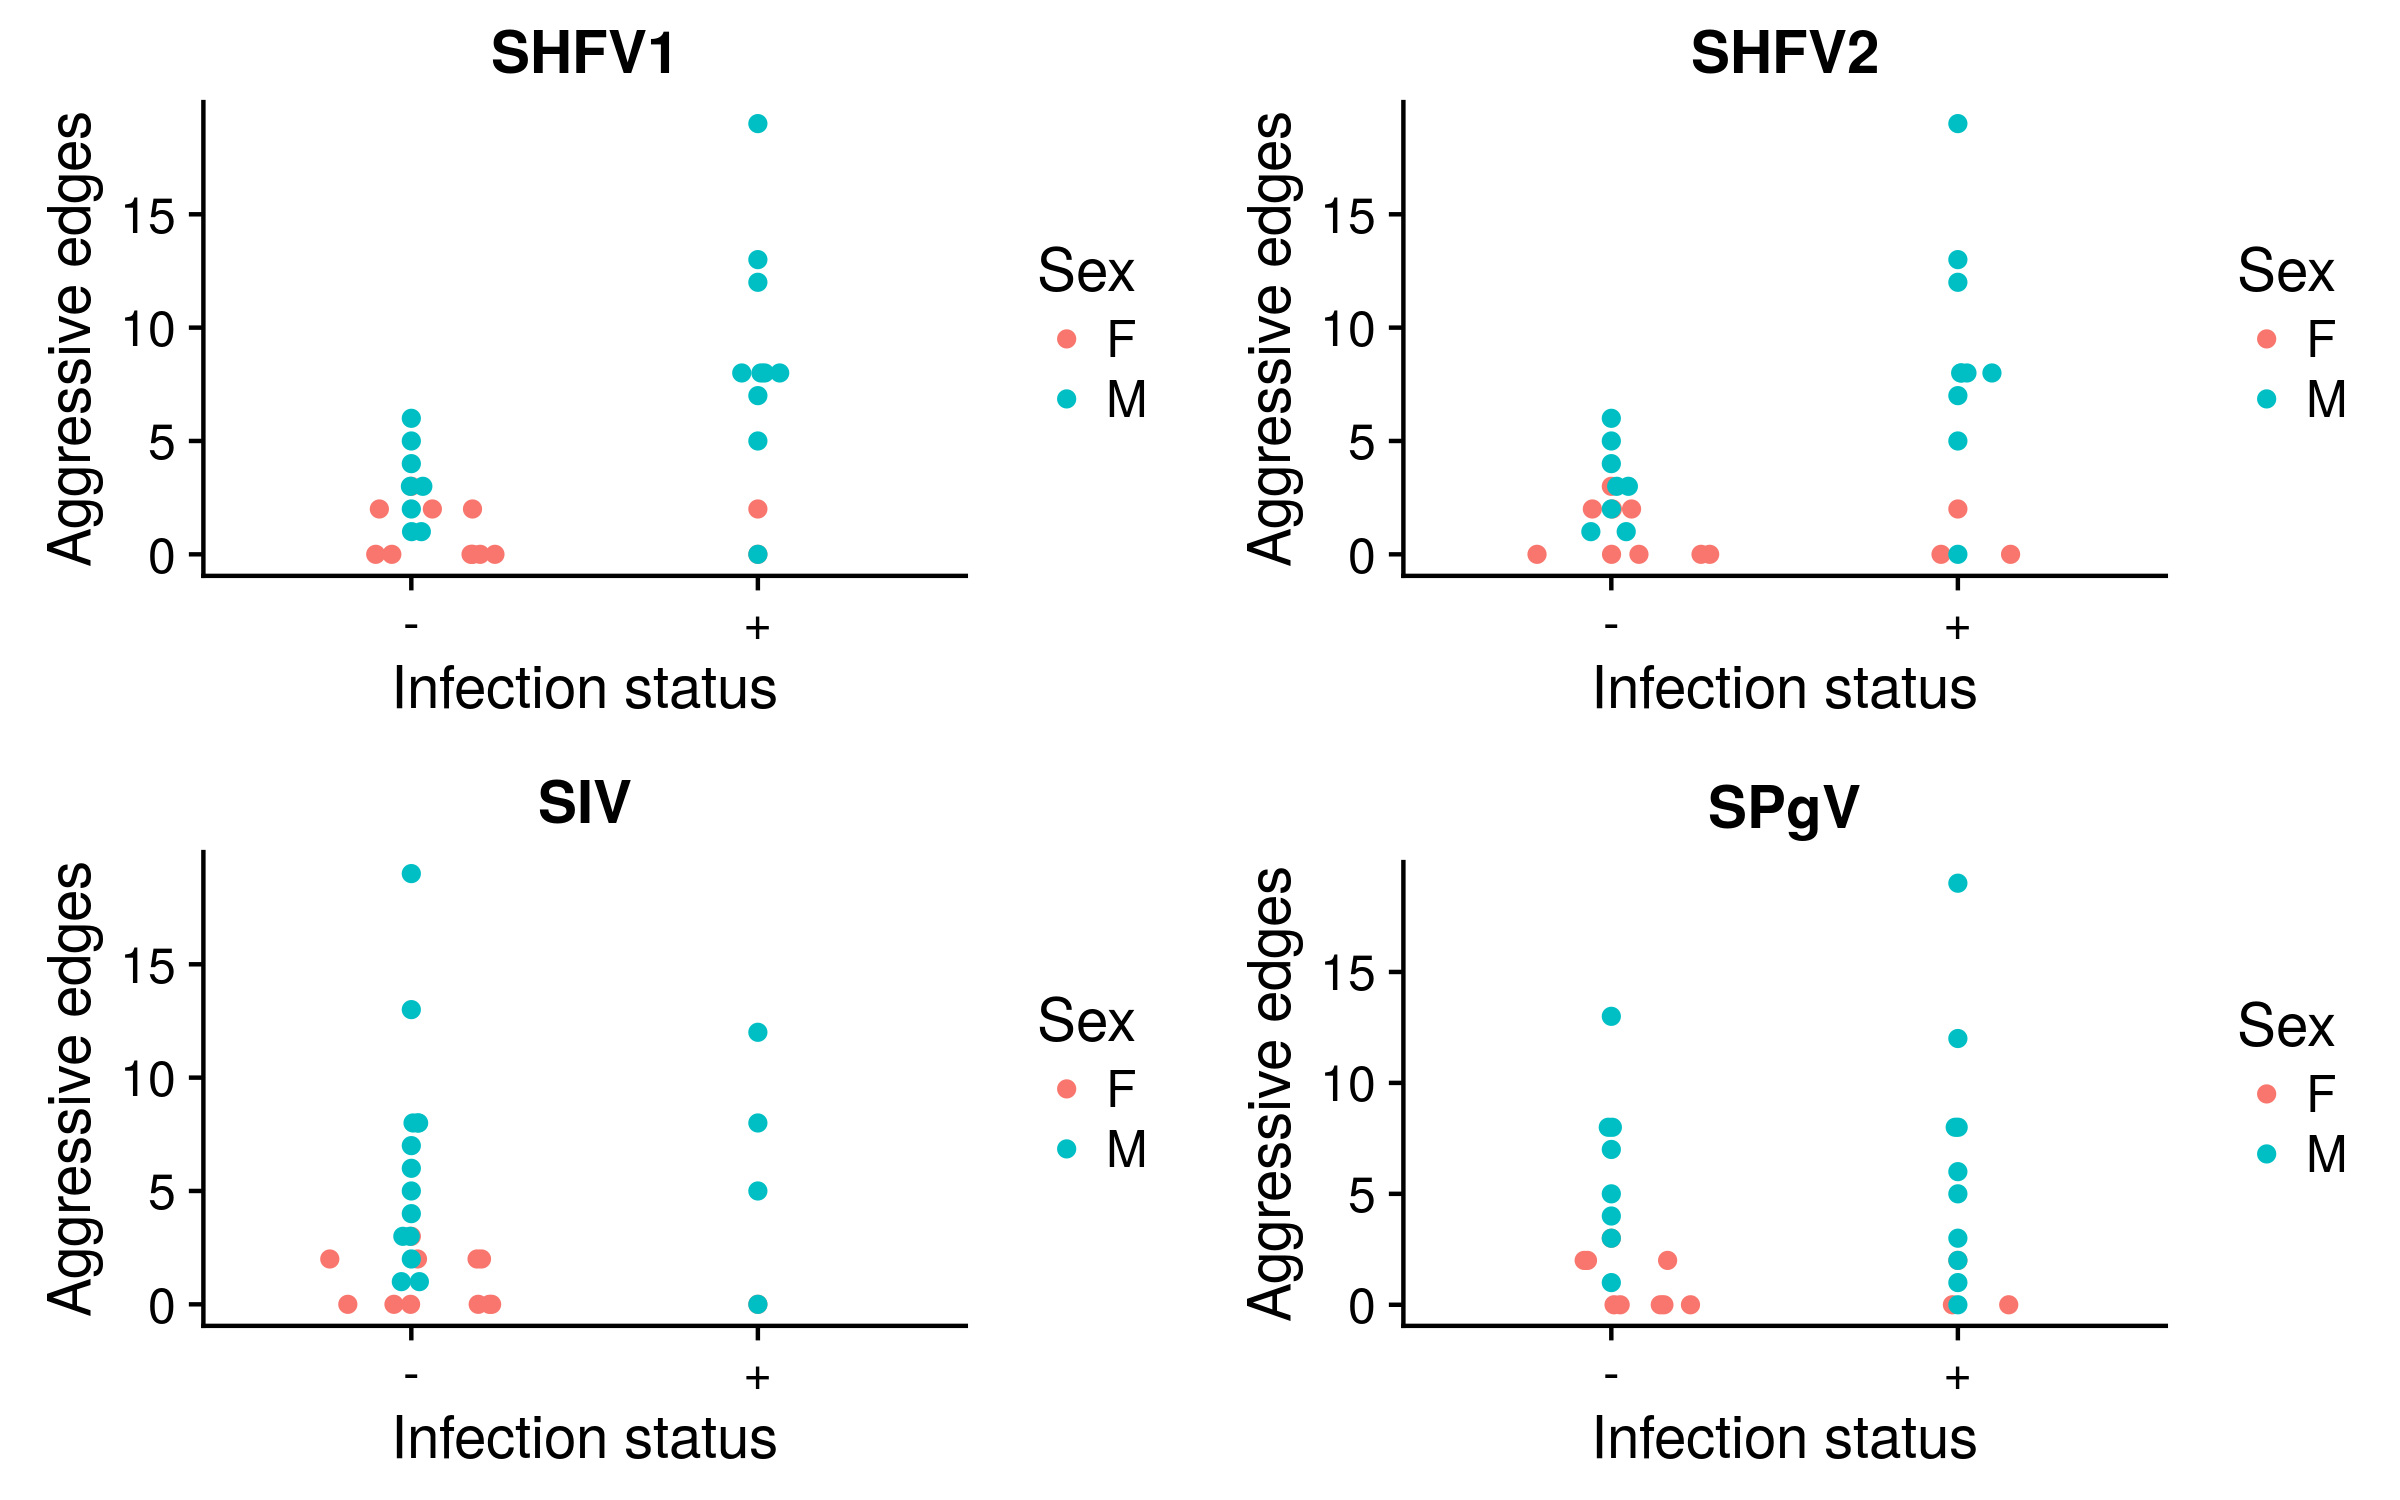
Aggressive interactions and infection
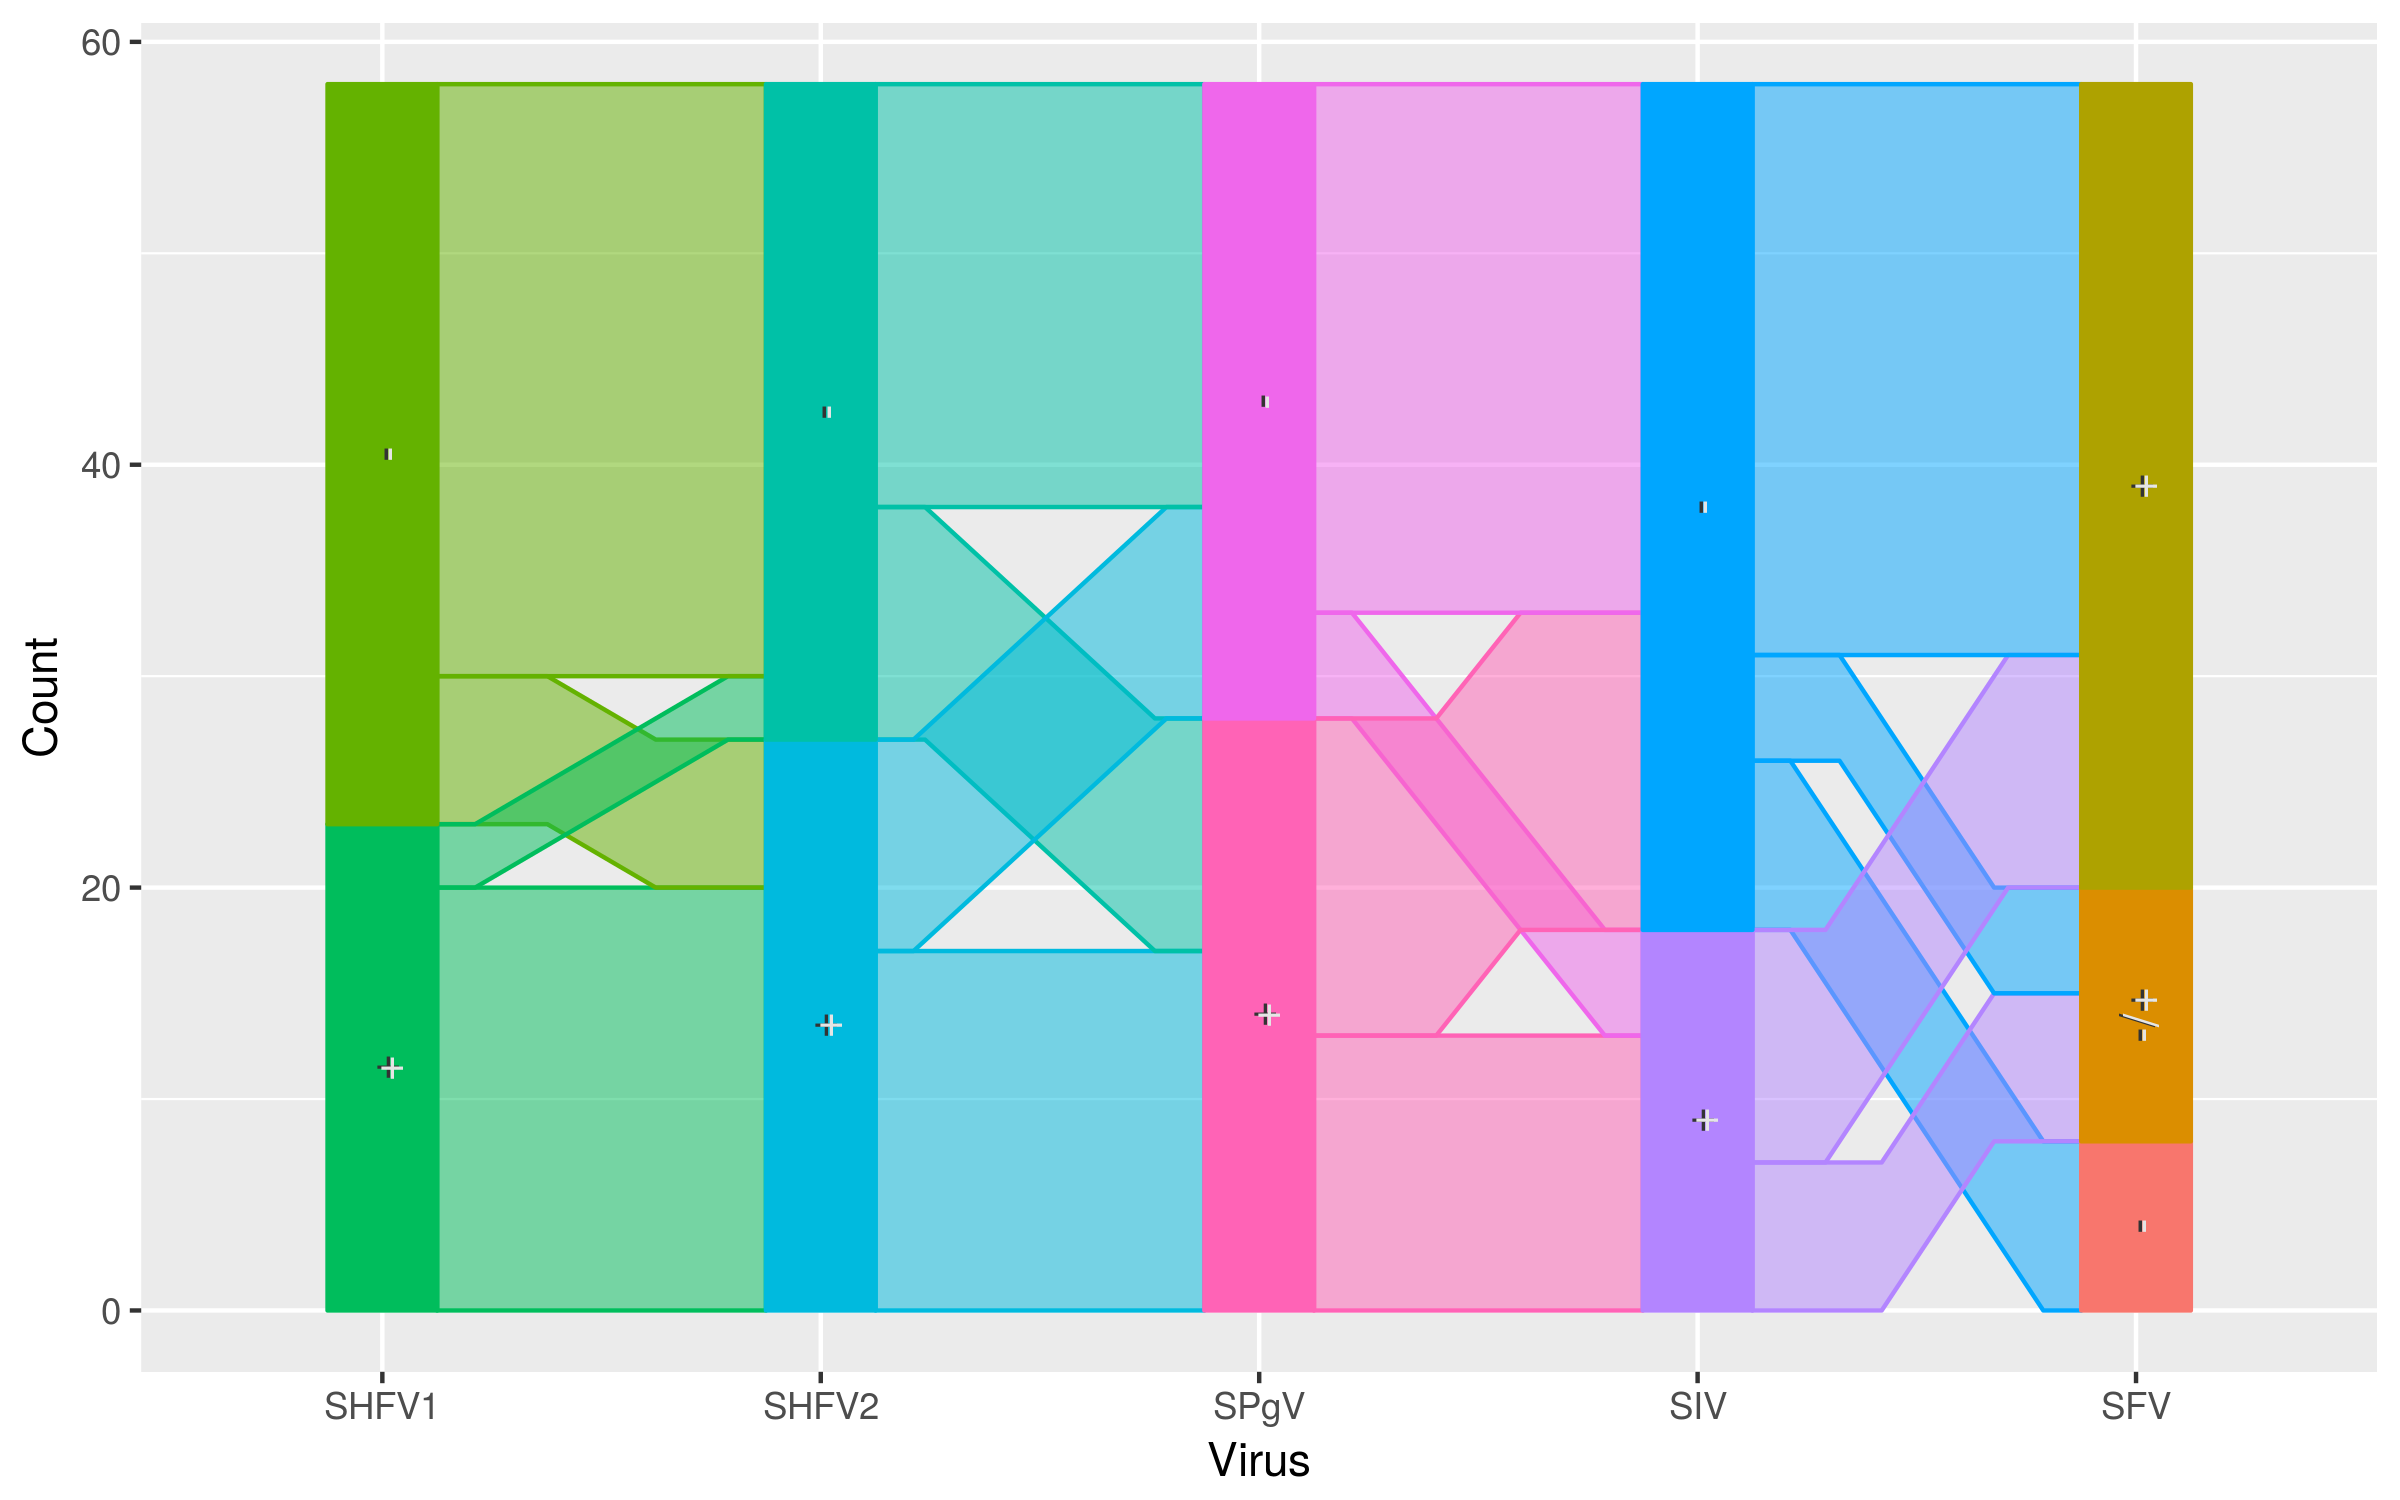
Co-infection
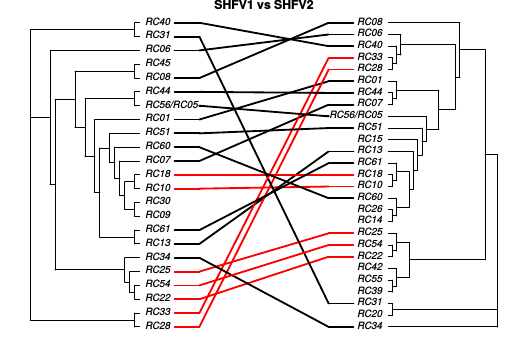
Co-transmission of SHFV
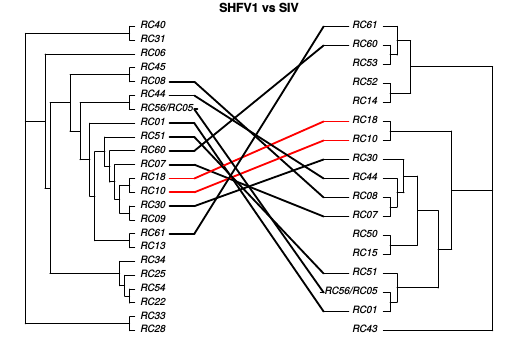
Shared risks with SHFV-1 and SIV
Recombination in SIV

Conclusions
- Networks are important for disease transmission
- It is difficult to obtain accurate information on contact networks
- Esp. for pathogens such as HIV
- Social network data may help to identify hotspots of transmission
- Sequence data provides objective data on transmission
- Best in conjunction with other forms of data
- Lots to do in terms of incorporating multiple infections, recombination etc.
Thanks!


Social network data